check GPU usage tells you whether your graphics card is actually doing its job or sitting half-idle while something else holds your games back. It is the single most useful number for diagnosing poor performance, spotting a bottleneck, or simply confirming your hardware is working as it should. This guide explains what GPU usage really means, how to check it with built-in and free tools, what a healthy reading looks like, and how to use it to find out why your frame rate is lower than expected.
Understanding GPU Usage and Why to Check It
GPU usage is the percentage of your graphics card’s capacity being used at any moment, and it is one of the clearest windows into how your system is performing. A card pinned near full usage is working hard as intended, while one sitting low during a demanding game is a strong sign that something else is the limiting factor. Checking it regularly turns vague performance complaints into a concrete diagnosis. Instead of guessing why a game feels sluggish, you get a clear number that points straight at the component responsible.
What GPU Usage Actually Tells You
GPU usage, shown as a percentage, indicates how much of your graphics card’s processing power is currently in use. During a demanding game, you generally want this number to be high, near 95 to 100 percent, because that means the card is the component setting your frame rate and is being fully utilised.
When usage is unexpectedly low in a demanding scenario, it signals that the GPU is waiting on something else, most often the processor. In other words, the number is not just a curiosity; it is the first clue in working out what is really limiting your performance.
Reading it correctly lets you tell the difference between a card that is genuinely maxed out and one that is being starved of work, which point to completely different solutions. One calls for lighter settings or a stronger GPU, while the other calls for attention to the processor or background tasks entirely.
What You Will Need
Everything needed to check GPU usage is free and quick to set up.
Windows Task Manager is built in and shows basic GPU usage with no installation at all, making it the fastest way to get a reading. For more detail and an in-game overlay, the free combination of MSI Afterburner and RivaTuner Statistics Server, usually bundled together, lets you see usage, clock speeds, and temperatures live while you play.
That is genuinely all you need, since these free tools cover everything from a quick desktop check to a full real-time overlay during gaming, with no paid software required. That makes monitoring accessible to absolutely everyone, regardless of budget.
What Healthy GPU Usage Looks Like
In a demanding game, healthy GPU usage is high, typically sitting in the mid-to-high nineties, which shows the card is the component doing the work. At the desktop or in a light application, low usage is completely normal and expected, since there is little for the card to do.
The pattern that matters is usage during heavy load. Consistently high usage in demanding games is exactly what you want, while persistently low usage in those same situations is the reading that warrants further investigation rather than the high one. In other words, do not worry about a busy card; worry about an idle one when it should be working.
It also helps to remember that brief dips in usage are perfectly normal, since loading screens, menus, and quieter moments simply do not demand the full power of the card. What you are looking for is the sustained level during active, demanding gameplay, not the momentary fluctuations that come and go from second to second as scenes change.
How to Check GPU Usage Step by Step
You can check usage in seconds with Task Manager or get a richer live view with a gaming overlay. Both methods are easy, and which you choose depends on whether you want a quick glance or detailed monitoring while you play.
Method 1: Windows Task Manager
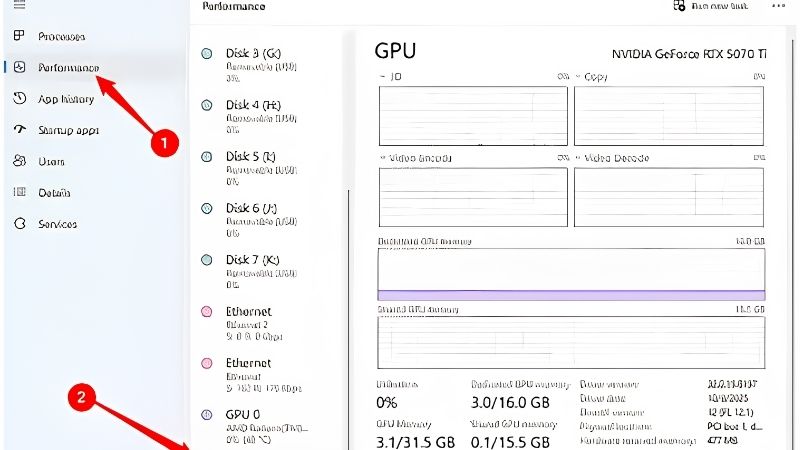
Right-click the taskbar and open Task Manager, then go to the Performance tab and select the GPU entry from the list on the left. You will see a live graph of GPU usage along with memory and temperature, giving you an instant overview with nothing to install.
This method is perfect for a quick check or for watching usage on a second monitor while a game runs in the foreground. It is less detailed than a dedicated overlay, but for confirming whether the card is busy or idle, it is fast and entirely sufficient. For a great many diagnostic questions, that simple yes-or-no answer is all you actually need.
One small tip is that Task Manager’s default GPU graph may show a less relevant engine, so clicking the dropdown above a graph and selecting a 3D or compute view gives a truer picture of gaming load. Making that one adjustment turns a sometimes-confusing readout into a reliable, at-a-glance gauge of how hard your card is working.
Method 2: In-Game Overlay (Afterburner and RTSS)
For live monitoring inside a game, set up an overlay with these steps:
- Install MSI Afterburner, which includes RivaTuner Statistics Server, the component that draws the on-screen overlay.
- Open Afterburner’s settings and the Monitoring tab, then tick “GPU usage” and choose to show it in the on-screen display.
- Add other useful readings such as GPU temperature, clock speed, and frame rate to the overlay so you see the full picture at once.
- Launch your game, and the overlay will appear in a corner, updating GPU usage live as you play.
This live overlay is the best way to see how usage behaves moment to moment in real gameplay, which is far more informative than a static desktop reading when you are diagnosing performance. Watching the numbers rise and fall through different scenes often reveals exactly where a game starts to struggle.
Reading Usage to Spot a Bottleneck
The most valuable use of GPU usage is identifying a bottleneck. If your GPU usage is high near 100 percent and your frame rate is lower than you would like, the graphics card is the limit, and lowering settings or upgrading the GPU is the path to more frames.
If GPU usage is low while your frame rate disappoints, something else, usually the CPU, is the bottleneck, and a faster processor or lighter CPU-bound settings will help more than a new graphics card. Checking usage before spending money is the smartest way to make sure you upgrade the part that is actually holding you back. More than a few people have bought a new graphics card only to find a CPU bottleneck was the real culprit all along.
Tips, Pitfalls, and Pros and Cons of Checking GPU Usage
Monitoring GPU usage is a powerful habit, but it is worth knowing how to read it accurately and where it can mislead. A little context turns the number into a genuinely useful diagnostic tool. Read alongside your frame rate and your CPU usage, that single percentage becomes a quick, reliable map of where your performance is being won or lost. With a little practice, a glance at it tells you almost instantly whether to adjust your settings, your processor, or nothing at all.
Pros and Cons of Monitoring GPU Usage
On the plus side, checking GPU usage is free, quick, and the single best way to diagnose performance problems and identify bottlenecks before spending money on upgrades. It also reassures you that your hardware is working as intended.
On the downside, a constant overlay can be mildly distracting, and the numbers can be misinterpreted without context, leading to wrong conclusions about what to upgrade. Used thoughtfully rather than obsessively, though, the benefits clearly outweigh these minor drawbacks.
For anyone who cares about performance, the verdict is that learning to read GPU usage is well worth the few minutes it takes to set up. It is one of those small skills that pays for itself the very first time it steers you away from the wrong upgrade.
Mistakes to Avoid When Reading Usage
The biggest mistake is panicking over low GPU usage at the desktop or in light games, where low usage is completely normal. The reading only matters under demanding load, so judge it there rather than when the card has nothing to do.
Another mistake is looking at GPU usage in isolation without checking CPU usage alongside it, which is essential for correctly identifying a bottleneck. Watching both together is what turns a single number into a clear diagnosis.
See More:
When Low GPU Usage Is a Problem
Low GPU usage becomes a problem specifically when it happens during a demanding game while your frame rate is below what you expect. That combination points to a bottleneck elsewhere, most commonly the CPU, a background process, or a frame-rate cap you forgot was enabled.
In those cases the fix is rarely a new graphics card, since the card is not the limit; instead, addressing the CPU, closing background tasks, or removing a frame cap is the answer. Diagnosing this correctly with a usage check can save you from an expensive upgrade that would not have helped.
To wrap up, knowing how to check GPU usage is the key to understanding your system’s performance, and it takes only seconds with Task Manager or a free overlay. Aim for high usage under load, read it alongside CPU usage to spot bottlenecks, and let it guide where you spend on upgrades. If a usage check confirms your graphics card is the limit, you can compare the recommended GPUs and monitoring tools linked below.


Write Your Review
No reviews yet. Be the first to share your experience!