CapFrameX GPU benchmark testing reveals the truth about your gaming smoothness that average frame rate completely hides: the stutters and dips that actually break immersion. If a game feels choppy despite a high frame rate, this tool explains why. It captures the frame times and 1% lows that matter most, and this review shows how well it works, what the numbers mean, and how to use them to make your gameplay genuinely smoother.
What CapFrameX Actually Measures
CapFrameX is a free capture and analysis tool that goes far deeper than a simple frame counter. It records the timing of every single frame, which is where real smoothness, or the lack of it, is revealed. Understanding what it measures is the key to using it well.
Why Average FPS Is Not Enough
Average frame rate is a single number that hides a lot. A game can average a healthy figure yet still feel choppy, because the average says nothing about the sudden dips that cause visible stutter.
CapFrameX exposes what the average hides. By recording every frame’s timing, it reveals the inconsistent moments that break smoothness, which is exactly the information gamers need to diagnose a stuttery experience.
This is why enthusiasts trust it over simple counters. Real smoothness is about consistency, not just a high average, and CapFrameX measures precisely that consistency.
A simple example makes the point clear. Imagine two systems that both average sixty frames per second: one delivers every frame at an even pace, feeling perfectly smooth, while the other alternates between bursts of very fast frames and sudden slow ones, feeling juddery despite the identical average. A basic frame counter would call them equal, yet anyone playing would immediately feel the difference. CapFrameX is built precisely to expose that gap, measuring the evenness of frame delivery rather than just how many frames arrive, which is why it changes how seriously people take their performance testing.
Understanding 1% and 0.1% Lows
The headline metrics are the 1% and 0.1% low frame rates. These represent your worst moments, the slowest one percent of frames, and they correlate far better with felt smoothness than the average does.
A big gap between your average and your 1% low signals stutter. If your average is high but your 1% low is much lower, the game will feel inconsistent despite the impressive headline number.
The 0.1% low takes this even further by capturing the very worst hitches. These are the rare but jarring pauses that make you notice something is wrong, and because they are so infrequent, they vanish entirely into an average yet dominate how a session feels. Watching both the 1% and 0.1% lows gives you a complete picture: the 1% low reflects your typical worst moments, while the 0.1% low catches the occasional severe stutter. Together they explain far more about your real experience than any single average figure ever could.
The table below explains the key metrics:
| Metric | What it means | Why it matters |
|---|---|---|
| Average FPS | Overall frame rate | General performance |
| 1% low | Slowest 1% of frames | Reveals common stutter |
| 0.1% low | Slowest 0.1% of frames | Reveals worst hitches |
| Frame time | Time per frame | Shows smoothness directly |
Reading Frame-Time Graphs
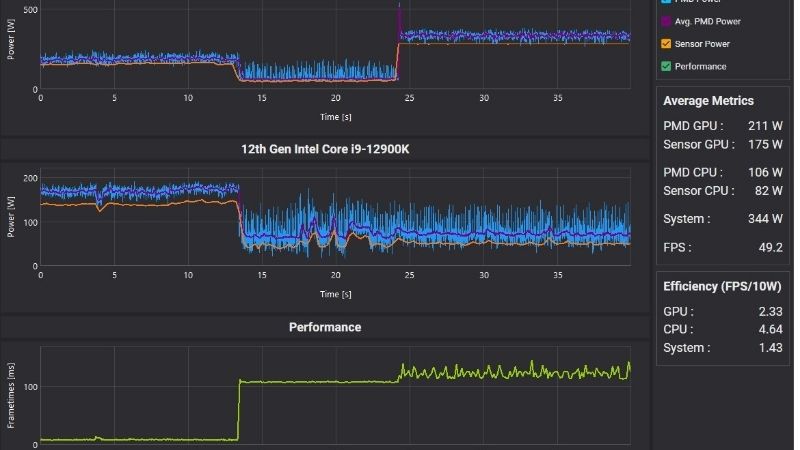
CapFrameX presents frame times as a graph, which makes smoothness visible. A flat, even line means consistent, smooth frames, while sharp spikes reveal the exact moments of stutter.
This visual approach is genuinely powerful. Instead of guessing, you can see stutter as spikes on the graph, then work out what caused them, whether heat, a setting, or a background program.
Comparing graphs before and after a change is invaluable. It shows clearly whether a tweak actually smoothed your gameplay, turning vague impressions into concrete evidence.
Learning to read the shape of the graph is a skill that pays off quickly. A healthy graph looks like a mostly flat line hugging a low frame-time value, with only small, gentle variations. Isolated tall spikes usually point to a specific event, such as loading new assets or a background program waking up, while a graph that is generally rough and jagged suggests a broader problem like thermal throttling or a struggling card. Once you can glance at the graph and interpret its shape, diagnosing stutter shifts from frustrating guesswork to a quick, confident reading of the evidence in front of you.
What Users Say About the CapFrameX GPU Benchmark
Beyond the metrics, feedback from enthusiasts shows how CapFrameX performs in real testing. Their experiences reveal consistent themes about its strengths and its learning curve, helping you decide if it suits you.
Why Enthusiasts Rely on It
Enthusiasts praise CapFrameX for revealing the truth about smoothness. They value being able to measure the 1% lows and frame times that actually determine how a game feels, rather than trusting a misleading average.
Its analysis tools earn strong praise too. Users appreciate the detailed graphs and easy comparisons, which let them prove whether a change improved smoothness with real data rather than guesswork.
Reviewers also value how CapFrameX brings professional-grade testing to ordinary players for free. The kind of frame-time analysis that hardware reviewers use to evaluate cards is available here to anyone willing to learn it, which means you can hold your own system to the same standard the experts apply. For enthusiasts who enjoy understanding exactly how their PC behaves, that access is genuinely empowering, turning vague complaints about a game feeling off into precise, evidence-based conclusions they can act on with confidence.
Common Criticisms to Keep in Mind
The main criticism is that it is more advanced than casual tools. The depth that enthusiasts love can feel like a learning curve to beginners, though focusing on the 1% low and frame-time graph makes it approachable.
Some also note it is a capture and analysis tool rather than a live overlay. It is best used to record and study sessions, so pairing it with a simple overlay covers live monitoring needs.
CapFrameX GPU Benchmark Pros and Cons
Here is the honest balance sheet before you rely on it:
Pros:
- Reveals true smoothness through 1% lows and frame times.
- Powerful graphs and easy before-and-after comparisons.
- Free and trusted by serious enthusiasts.
Cons:
- Steeper learning curve than basic tools.
- A capture tool rather than a live overlay.
- Measures problems but cannot fix them for you.
The verdict is clear: for anyone serious about understanding and improving gaming smoothness, CapFrameX is one of the most revealing free tools available, once you focus on the key metrics.
Using CapFrameX to Smooth Your Gameplay
CapFrameX is only valuable if you act on what it reveals. Once you can see your stutter, a few practical steps can flatten those spikes and deliver the smooth experience the data shows you are missing.
Fixing Stutter Caused by Heat
A common cause of poor 1% lows is thermal throttling. If your card overheats mid-session, it slows down in bursts, which appears as stutter spikes on your frame-time graph.
Better cooling directly improves these dips. A set of quality case fans keeps your card cool enough to hold its clocks, smoothing the frame times that heat was disrupting.
For older cards, fresh thermal paste helps too. Replacing dried-out paste can lower temperatures enough to remove throttling-related stutter that CapFrameX reveals, restoring the even frame pacing you are aiming for.
Tuning Settings for Consistency
CapFrameX makes settings tuning precise. By recording before and after changing a graphics setting, you can see exactly which options improve your 1% lows rather than guessing.
Sometimes lowering one demanding setting transforms smoothness. The tool shows when a single option is causing most of your stutter, letting you fix it without sacrificing overall visual quality.
A frame-rate cap can also help consistency. Pairing CapFrameX analysis with a sensible cap often flattens frame times, delivering the steady experience the graph reveals you were missing.
This methodical, data-driven approach is what sets CapFrameX apart from simply fiddling with settings and hoping. Rather than changing several options at once and guessing which helped, you alter one thing, record a fresh run, and compare it directly against the last. Over a few short sessions this builds a precise picture of exactly which settings your particular system handles smoothly and which cause trouble, letting you craft a configuration tuned to consistency rather than just a high average. It is slower than blind tweaking, but it produces results you can actually trust and repeat.
Knowing When to Upgrade
Sometimes the data simply shows a card at its limit. If your 1% lows are poor even when cool and well-tuned, your card may lack the power for the games you play at your settings.
CapFrameX makes the case for an upgrade clear. Seeing consistently weak lows on a healthy, cool card tells you honestly that more graphics power is the real solution, so you can invest with confidence rather than doubt.
Ready to smooth out your gameplay? If CapFrameX reveals heat-related stutter, use the links on this page to grab quality case fans or thermal paste, or to compare a stronger graphics card that can deliver the consistency you want.
See More:
Conclusion
CapFrameX GPU benchmark testing reveals the truth about gaming smoothness that average frame rate hides, using 1% lows and frame-time graphs to expose the stutter that actually breaks immersion. Focus on the key metrics, compare before and after your changes, and treat heat-related spikes as a clear cue to act on your cooling. If cooling is the limit, better airflow is the answer, so use the links above to grab quality case fans or thermal paste and enjoy the smooth, consistent gameplay your data shows is possible.


Write Your Review
No reviews yet. Be the first to share your experience!