
- Top Pick: RTX AI PC Guide: Beginner’s Handbook to NVIDIA RTX Setup, GPU Performance & AI Computing Optimization
- Best Value: AI Data Center Infrastructure Engineering: Power Distribution, Liquid Cooling, High-Density Networking, and Energy Efficiency for GPU Training Clusters … Hardware & Compiler Engineering Series)
- Premium Choice: Aquacomputer AMPINEL 12V-2×6 Graphics Card Power Management – Type A (53319)
RTX 5080 TechPowerUp is a search that tells me exactly who you are: someone who wants a table, not a personality. You have decided that the way to evaluate a graphics card is to look at a relative performance database and a power consumption chart, and you are right. So this page will not pretend to replace TechPowerUp’s review — go read it, it is excellent and it is linked in every reference to it below. What this page does instead is explain how to read that data correctly, where their methodology has blind spots worth knowing about, and what the numbers add up to for a buying decision.
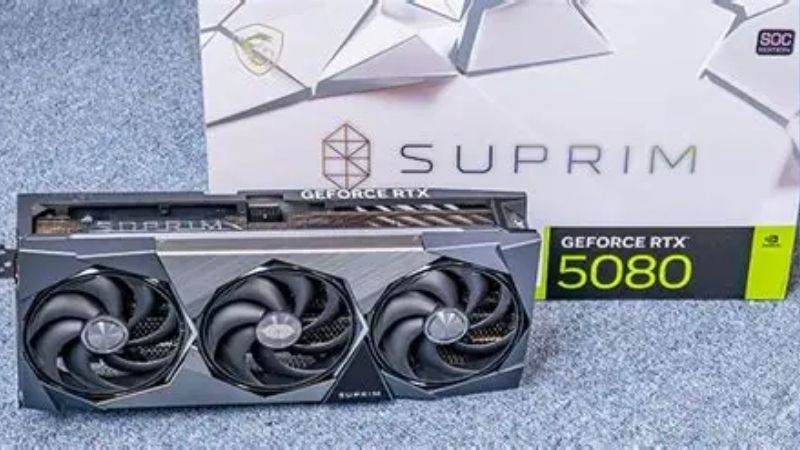
Why You Are Searching for TechPowerUp Specifically
Because they publish the one thing almost nobody else does: a consistent relative performance database that positions every card against every other card, maintained across generations with a stable methodology. That consistency is the product. Any site can benchmark a 5080. Very few can tell you what it means relative to a card from three generations ago, tested the same way.
What Their Relative Performance Database Actually Does
It normalises. Rather than giving you raw frame rates from a test rig you do not own, it expresses every card as a percentage of a reference point, aggregated across a large game suite at multiple resolutions.
This is more useful than raw numbers for the decision you are making, and the reason is subtle. Raw frame rates are a property of the whole system — CPU, RAM, resolution, settings, driver version, game patch. A relative percentage strips most of that out. When you want to know “is a 5080 enough of a jump from my 3080”, the percentage answers it and the frame rate does not.
The trade-off: percentages hide the shape of the difference. A card 40% faster on average might be 15% faster in your game and 70% faster in one you never play. Which brings us to the limits.
The Numbers Worth Looking For and Why
If you are reading a card review as a data source rather than entertainment, four figures carry nearly all the information:
- Relative performance at your resolution. Not the average across all resolutions — the specific one. A 5080’s positioning at 1440p and at 4K are different stories.
- Power under gaming load, not the TDP on the box. TDP is a design target; measured draw is what your PSU experiences.
- Performance per dollar, which repositions cards dramatically and is the metric most reviews bury.
- Noise in dBA at a stated distance. Meaningless without the distance, and frequently omitted elsewhere.
Everything else — the unboxing photos, the PCB analysis, the thermal imaging — is interesting and does not change what you buy.
Where the Methodology Has Real Limits
Worth knowing, because a database this good invites over-trust. Three limits matter for the 5080 specifically.
First, aggregate suites average away VRAM cliffs. A card that runs 90 FPS in nineteen games and stutters horribly in the twentieth posts a fine average. The 5080’s 16GB is comfortable today, so this does not bite yet — but it is the reason aggregate data on 8GB cards is misleading, and it is a structural property of the method rather than an oversight.
Second, upscaling is typically excluded to isolate hardware. Correct methodology, incomplete picture. Nobody plays a 5080 at 4K native, so the native numbers describe a scenario that does not occur.
Third, review-day data is a snapshot. Drivers move. The 5080 today is not the 5080 at launch, and a database entry does not always reflect that.
The RTX 5080 by the Numbers
Our own assessment, arranged for the same kind of reader. Specifications first, positioning second, thermals third.
Specifications That Determine Everything
| Specification | RTX 5080 |
|---|---|
| Architecture / die | Blackwell, GB203 |
| CUDA cores | 10,752 |
| VRAM | 16GB GDDR7 |
| Memory bus | 256-bit |
| Bandwidth | ~960 GB/s |
| Board power | 360W |
| Power connector | 1x 12V-2×6 |
| PSU recommended | 850W |
| Upscaling | DLSS 4.5, MFG up to 6X |
| Launch price | ~$999 |
Two rows do the analytical work. 960 GB/s on a 256-bit bus is entirely a GDDR7 achievement — the same bus width on GDDR6 delivers roughly two-thirds of that. At 4K, where the working set stops fitting in cache, that bandwidth is a large share of why this card holds up where a 5070 Ti does not.
The 16GB row is the honest limitation and it deserves stating without spin. It is comfortable at 4K in 2026 and it will be adequate rather than generous by 2028. Anyone telling you 16GB is a scandal is overstating it; anyone telling you it is future-proof is also wrong.
Performance Positioning Against the Stack
Where it sits, expressed the way you actually want it.
| Comparison | 5080 relative | Read this as |
|---|---|---|
| vs RTX 5090 | ~60-65% | The 5090 costs 100% more for ~55% more |
| vs RTX 5070 Ti | ~125-130% | The sensible step up if 4K matters |
| vs RX 9070 XT | ~130-140% | But the 9070 XT costs 40% less |
| vs RTX 4080 Super | ~110-115% | Not an upgrade if you own one |
| vs RTX 3080 | ~190-200% | This is the upgrade that makes sense |
The 4080 Super row is the one to internalise. A 10-15% generational gain is not an upgrade, it is a sidegrade with a receipt. If you own a 4080 Super, the 5080 is not for you regardless of what any chart shows — the only thing you gain is multi-frame generation.
The 3080 row is the opposite case and it is where this card’s actual buyers are. Roughly double the performance, plus 16GB against 10GB, plus DLSS 4.5. That is a real generational jump.
Power, Thermals and Acoustics
360W board power, and this is where measured data beats the spec sheet. Real gaming draw sits close to the rated figure on stock cards, with transient spikes higher — which is why the 850W PSU recommendation is not conservative padding, it is a response to transient behaviour that a 750W unit can trip on.
Founders Edition models run around 72-77C under sustained load. Partner cards with heavier coolers land 4-8C lower and correspondingly quieter — roughly 34-38 dBA at one metre against the FE’s 38-42.
Physically: FE is dual-slot; partner models frequently run 3 to 3.5 slots at 320-340mm. Measure to the side panel including bend clearance for the 12V-2×6 connector, not just to the drive cage. This is the most common cause of returns in this class.
Pros and Cons of the RTX 5080
The criticisms of this card are real, and so are the reasons it sells. Both deserve stating without advocacy.
What the Card Genuinely Does Well
It is the sensible 4K card, and that is not a small claim in a market where the alternative costs $2,000. High settings across essentially everything at 4K, with DLSS 4.5 available for high refresh panels, at 360W and an 850W supply rather than 575W and 1000W.
GDDR7’s 960 GB/s is doing more work than the core count suggests. At 4K it is the difference between this card and the 5070 Ti being a 25-30% gap rather than a 15% one.
And DLSS 4.5’s multi-frame generation — fixed 5X and 6X modes, plus a Dynamic mode that shifts the multiplier in real time to hit your display’s refresh rate — is a genuine capability. One caveat worth knowing: Dynamic mode is not compatible with frame rate limiters or V-Sync, which catches people who cap frames by habit.
The Criticisms That Hold Up
16GB on a $999 card in 2026 is defensible and unimpressive. It is enough now. It will not age gracefully, and the 5090’s 32GB on the tier above makes the gap look deliberate rather than technical.
The generational gain over the 4080 Super is the more serious criticism. 10-15% is thin for a new architecture, and most of what makes the 5080 feel newer is a software feature — multi-frame generation — rather than silicon.
And 360W is a lot. Not 5090 territory, but enough that a PSU upgrade is a real line item for anyone coming from a 650-750W build. Add $150 to the sticker if that is you.
Pros and Cons Summary
| Pros | Cons |
|---|---|
| The sensible 4K card at half a 5090’s price | 16GB is adequate now, not future-proof |
| 960 GB/s from GDDR7 on a 256-bit bus | Only 10-15% over a 4080 Super |
| DLSS 4.5 with 5X/6X and Dynamic MFG | 360W may force an 850W PSU upgrade |
| 360W is manageable where 575W is not | 12V-2×6 needs bend clearance; 3.5-slot models are large |
| ~60-65% of a 5090 for ~50% of the price | Dynamic MFG breaks with V-Sync and frame limiters |
Net: a good card with an unexciting generational story, in a segment where the alternatives are worse. That is a real verdict, and it is duller than any headline.
Market Context Before You Buy
Every number above assumes a price. That price has been the least stable variable in this entire analysis, and for a data-driven buyer it deserves the same scrutiny as the benchmarks.
Why RTX 5080 Pricing Has Not Softened
Component and laptop prices have kept trending upward rather than settling back, and graphics cards absorbed a disproportionate share because of memory. GDDR7 is new, supplied by very few manufacturers, and this card carries 16GB of it.
The consequence is a card that has held near its launch price rather than following the usual second-year drift downward. There is no margin left to give — the bill of materials has risen underneath it.
The practically useful part of this for someone reading charts: it changes what performance-per-dollar means. That metric assumes prices move. When they do not, the ranking you computed at launch is still the ranking today, which is unusual and makes historical price-performance data more reliable than it normally would be.
Prices Flattened, But Relief Is Distant
The good news is real and deserves precision rather than optimism. The steep climb of late 2025 has eased. Framework, which publishes unusually candid component pricing updates, has described a stretch of relative stability while continuing to warn that volatility has not ended. Stabilisation is not a decline.
New capacity is genuinely coming. OEMs can now source DDR5 from Chinese manufacturers such as CXMT, and Micron is building two fabs in Idaho. Both add real supply. Neither begins production before 2027-2028, which is a full GPU generation beyond this purchase.
So: flat, not falling, with relief two to three years out. If you have been waiting for the 5080 to approach MSRP, the evidence says that wait has no arrival date attached.
Which RTX 5080 to Actually Buy
Here is where the data-driven approach pays off, and it is the least discussed part of the decision. The gap between the cheapest 5080 and the most expensive one is roughly $150-250. The performance gap between them is 2-4%.
What the premium buys is a heavier cooler — worth 4-8C and roughly 4 dBA — plus RGB and a longer warranty. Whether that is worth $200 depends entirely on your case airflow and how long you keep hardware. For a mesh-front case and a three-year cycle, it is not.
Compare current pricing across the base and premium 5080 models before you order, and check the RX 9070 XT and 5070 Ti at the same time — the ordering between all four moves month to month, and the cheapest 5080 is frequently the best-value card in the entire segment.
See More:
- GTX 1650 vs RTX 3050
- Nvidia DIGITS
- Nvidia cuDNN
- Radeon RX 9070 XT vs RTX 5090
- PNY GeForce RTX 5080 review
Conclusion: Reading RTX 5080 TechPowerUp Data Properly
If you searched RTX 5080 TechPowerUp, you were doing the right thing — their relative performance database is the most useful single resource for positioning a card, and you should read it. Just read it knowing its three limits: aggregate suites average away VRAM cliffs, upscaling is excluded so the native numbers describe a scenario nobody plays, and review-day data is a snapshot that drivers move underneath.
On the card itself: the RTX 5080 is the sensible 4K purchase, roughly 60-65% of a 5090 for about half the money, with 16GB that is comfortable now and unremarkable by 2028. Buy it if you are coming from a 3080 or older, where it roughly doubles your performance. Do not buy it if you own a 4080 Super — 10-15% is not an upgrade. And when you do buy, take the cheapest model from a brand you recognise: 2-4% is not worth $200, and that is exactly the kind of conclusion the numbers give you and the marketing never will.
Frequently Asked Questions
What does the relative performance percentage in the charts mean?
It is an aggregate of many game results at a given resolution, normalised so one card equals 100 percent. It is useful for ranking but hides variance, since a card can be 15 percent ahead in raster and behind in ray tracing. Always check the per-game pages before making a decision on a specific title.
Why do the listed specifications differ from what my card reports?
Database entries list reference clocks and reference board power. Partner cards ship with factory overclocks, higher power limits and different fan curves, and GPU-Z will report the actual BIOS values on your card. Boost clock is also a floor rather than a ceiling, since real boost depends on temperature, power headroom and the workload.
Are the noise and temperature figures comparable to my build?
Only loosely. Those numbers come from an open test bench or a standardised case at a fixed ambient temperature. Inside a real case with restricted airflow you should expect several degrees higher on the core and considerably more on the memory junction and hotspot readings, plus higher fan speeds and noise.
What are the key RTX 5080 specifications to look at?
The headline numbers are 16GB of GDDR7 on a 256-bit bus for roughly 960GB/s of bandwidth, 10752 CUDA cores, a 360W board power, PCIe 5.0 x16 and a single 12V-2×6 connector. Those explain both its 4K capability and why 850W is the recommended power supply figure.
Can I trust the value and performance per dollar rankings?
They are a snapshot using launch or MSRP pricing, which rarely matches street prices. Recalculate using what you would actually pay locally, including any bundled game or cooler premium. A card that ranks poorly at MSRP can become the best value in the chart after a 15 percent retail discount.
As an Amazon Associate we earn from qualifying purchases at no extra cost to you.


Ready to decide? Our #1 pick for 2026 is the Architecture / die.
Live price & availability on Amazon.
Write Your Review
No reviews yet. Be the first to share your experience!