
- Top Pick: 12VHPWR 90 Degree Adapter to 2X 8Pin: 16AWG 16 PIN GPU Right Angle PCI-E 5.0 Extension for for Graphic Card GPU 12+4pin RTX 3090Ti 4070Ti 4080 4090 (Type B)
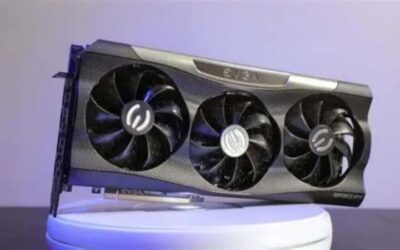
- Best Value: EVGA GeForce RTX 3090 Ti FTW3 Ultra Gaming, 24G-P5-4985-KR, 24GB GDDR6X, iCX3, ARGB LED, Backplate, Free eLeash
- Premium Choice: RTX AI PC Guide: Beginner’s Handbook to NVIDIA RTX Setup, GPU Performance & AI Computing Optimization
RTX 5070 Ti TechPowerUp is a search with a specific shape: you are not looking for a personality, you are looking for data. TechPowerUp’s GPU database and review charts are where enthusiasts go when marketing claims stop being useful, and the 5070 Ti is a card where the gap between claim and measurement is worth understanding. This piece covers the specifications behind the numbers, the manufacturing defect worth checking on your own card, why relative-performance percentages mislead in both directions, and what the card actually costs as of July 2026.
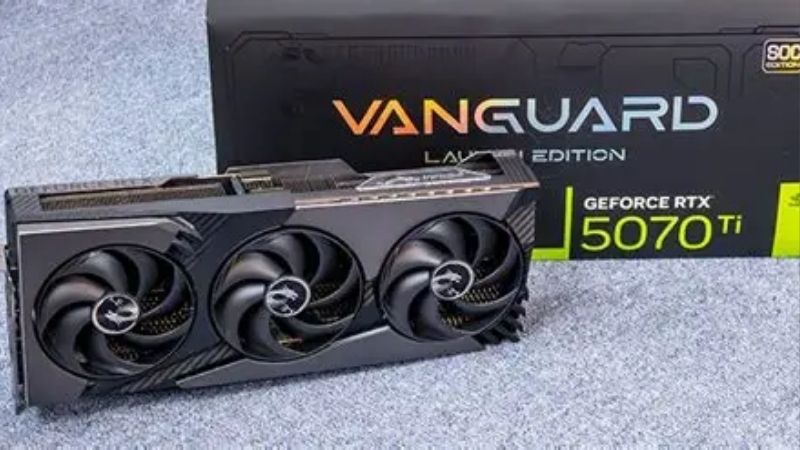
The RTX 5070 Ti Specification Set Behind the Charts
Before any benchmark means anything, the configuration has to be clear — because the 5070 Ti’s position in the stack is less obvious than its name. It is not a slightly cut RTX 5080 in the way the numbering implies, nor is it a scaled-up RTX 5070. It occupies a specific point that explains most of its chart behaviour.
Silicon: A Cut-Down GB203, Not a Bigger GB205
The RTX 5070 Ti uses the GB203-300-A1 die — the same silicon family as the RTX 5080, harvested down to 8,960 CUDA cores across 70 SMs against the 5080’s 10,752. It carries 70 fourth-generation RT cores and 280 fifth-generation Tensor cores.
This matters for chart interpretation. The 5070 Ti inherits the 5080’s memory subsystem: 16GB of GDDR7 at 28 Gbps on a full 256-bit bus, for 896 GB/s. The 5080 runs the same bus at slightly higher speed for 960 GB/s — a 7% gap against a 20% core-count gap.
The RTX 5070 below it, by contrast, drops to the smaller GB205 die with 6,144 cores and a 192-bit bus at 672 GB/s. The step down from 5070 Ti to 5070 is architecturally larger than the step up to the 5080, which is exactly backwards from what the naming suggests.
| Spec | RTX 5070 | RTX 5070 Ti | RTX 5080 |
|---|---|---|---|
| Die | GB205-300-A1 | GB203-300-A1 | GB203-400 |
| CUDA cores | 6,144 | 8,960 | 10,752 |
| RT cores | 48 | 70 | 84 |
| Memory | 12GB GDDR7 | 16GB GDDR7 | 16GB GDDR7 |
| Bus | 192-bit | 256-bit | 256-bit |
| Bandwidth | 672 GB/s | 896 GB/s | 960 GB/s |
| TDP | 250W | 300W | 360W |
| MSRP | $549 | $749 | $999 |
The ROP Defect Worth Checking on Your Own Card
This is the single most useful thing a data-minded buyer can take away. A small fraction of early RTX 50 production — reported at under 0.5% of units — shipped with a disabled ROP unit, reducing render output throughput below spec.
The card works. It posts, it games, it reports normally in Device Manager. It is simply a few percent slower than the reviews you are reading, and nothing in Windows will tell you.
The check takes thirty seconds: open GPU-Z and read the ROPs field. An RTX 5070 Ti should report 80. If yours shows fewer, that is an RMA case, and it is worth doing early rather than after a return window closes. This is precisely the sort of thing chart-readers should verify rather than assume — your card may not be the card that was reviewed.
No Founders Edition, So Every Chart Is an AIB Chart
Nvidia did not produce a Founders Edition RTX 5070 Ti. Production was left entirely to board partners, which has a consequence people miss when reading benchmarks: there is no reference card to normalise against.
Every review number you see came from a specific AIB model with its own cooler, power limit, and factory clock. Reference boost sits around 2452 MHz, but shipping cards vary — the MSI Gaming Trio OC runs 2572 MHz on a 338mm triple-fan cooler, while cheaper variants sit closer to reference.
The practical translation: a 3–4% spread between charts for “the RTX 5070 Ti” is not measurement error, it is different cards. When comparing two reviews, check which model each tested before concluding anything.
Reading Relative Performance Numbers Correctly
The relative performance percentage is the most-cited and most-misread figure in any GPU database. It compresses a large test suite into one number, which is useful for placement and misleading for purchase decisions — because your games are not the test suite.
Why the 5070 Ti Sits Closer to the 5080 Than Expected
Aggregate testing puts the 5070 Ti at roughly 85–90% of RTX 5080 rasterization performance at 4K, and around 10–14% behind at 1440p. Against a 20% core-count deficit, that looks like the 5070 Ti punching above its configuration.
It is not mysterious. The two cards share a memory subsystem that differs by only 7%, and at high resolutions bandwidth becomes the limiting factor more often than shader count. The 5080’s extra cores have less to do than the spec sheet implies.
This also explains why the gap widens in bandwidth-heavy scenarios and narrows in shader-bound ones. A single aggregate number averages both cases and shows you neither.
Where the Generational Uplift Claims Break Down
Nvidia’s launch materials advertised up to 2x the performance of the previous generation. Independent testing put the native rasterization gain at 10–15% over the RTX 4070 Ti SUPER, with roughly 20% in native ray-traced scenarios against the 4070 Ti.
Both figures are accurate. They measure different things. The 2x number includes DLSS 4 Multi Frame Generation, which is exclusive to RTX 50 hardware — so the comparison is a 50-series card with MFG against a 40-series card without it.
Whether that is fair depends on whether you will use MFG. If you play titles that support it and you are feeding a high-refresh panel, the uplift is real and you will experience it. If you play competitive titles where you would disable frame generation for latency reasons, the honest generational number is the 10–20% one.
The Numbers That Matter More Than the Aggregate
Three figures deserve more attention than the headline percentage. First, 1% lows rather than averages — stutter is what you feel, and two cards with identical averages can differ substantially here.
Second, frame time consistency under sustained load rather than benchmark-run peaks. A card that holds 2572 MHz for twenty minutes performs differently from one that boosts high and settles low, and short benchmark runs hide this.
Third, VRAM allocation against usage. Allocation figures in monitoring tools show what a game reserved, not what it needed. The 16GB on this card is comfortable at 1440p and adequate at 4K, and reading allocation graphs as capacity warnings produces false alarms.
Pros and Cons of the RTX 5070 Ti on the Data
Stripped of enthusiasm, the case for and against this card is unusually clear. It is well-configured hardware sold into a market that has made its list price meaningless, and your verdict depends almost entirely on which of those two facts you weight.
What the Data Supports
The memory configuration is the strongest argument. 16GB on a full 256-bit bus at 896 GB/s is the specification that makes this card age well — it is a 78% bandwidth increase over the 4070 Ti, and it resolves the VRAM constraint that dogged the 12GB 4070 Ti.
Second, efficiency positioning. At 300W it delivers 85–90% of a 360W card’s performance, which is a favourable performance-per-watt ratio and a meaningfully cheaper PSU requirement: 750W recommended against the 5080’s 850W.
Third, at MSRP it is one of the better-value launches Nvidia has produced in this tier for several generations — $749 for near-5080 performance is a strong proposition, and it competes directly with AMD’s RX 9070 XT.
What the Data Undermines
Street pricing destroys the value case. As of July 2026, cards list at $979–$1,049 at major retailers, with marketplace sellers at $1,299–$1,420. At $1,000+, a card justified by its $749 MSRP is being judged on a price that does not exist.
Second, the generational uplift is modest without MFG. 10–15% over a 4070 Ti SUPER is not an upgrade for anyone who owns one.
Third, 16GB is now the debated figure rather than the reassuring one. The rumoured SUPER refresh would take this tier to 24GB via 3GB GDDR7 modules — but that has slipped toward late 2026 or CES 2027 on memory supply, so it is not a decision you can wait for.
What the 2026 Market Does to These Numbers
Every performance-per-dollar figure in every chart uses MSRP, and MSRP has not been a real price for this card since launch. That single fact distorts the conclusions more than any benchmark methodology dispute.
Why the MSRP Charts Lie
Supply has been constrained since the February 2025 launch, driven primarily by DRAM shortages. Board partners have used compliance pricing — briefly listing at MSRP for reviews, then raising it. The $749 figure in every value chart is a number almost nobody has paid.
The good news is real but weak and distant. The steep climb through late 2025 has flattened, and Framework has reported a stretch of relative stability while still warning of volatility. Supply is opening up: OEMs can source DDR5 from Chinese suppliers such as CXMT, and Micron is building two Idaho fabs. Those plants do not produce until 2027–2028. Prices stopped rising sharply; they have not fallen.
The H200 Approval and Why Relief Is Not Coming
The United States has approved Nvidia selling the H200 into China. For anyone reading GPU charts, the relevance is that consumer cards and datacentre accelerators compete for the same advanced packaging capacity and high-bandwidth memory. A large new market for the highest-margin silicon removes the pressure that would push GeForce pricing down.
The evidence is already in the roadmap, and for this card specifically it is stark. At CES 2026, ASUS told Hardware Unboxed that Nvidia had stopped supplying GB203 dies for the RTX 5070 Ti and had placed the model into end-of-life status. Nvidia publicly disputed this, stating all SKUs remain in production; ASUS subsequently called the reports incomplete. The dispute is unresolved, but the market data is not ambiguous — retailers went weeks unable to source stock, prices moved from roughly $730 in November to $830 by January, and one major US retailer jumped from $835 to $990 overnight.
The logic is straightforward once you know the silicon. The 5070 Ti and the 5080 are both GB203. With GDDR7 constrained and 16GB parts consuming twice the modules of 8GB ones, Nvidia has an obvious incentive to ship every usable GB203 as the higher-margin 5080. The RTX 50 SUPER refresh has slipped toward late 2026 or 2027 on the same memory supply, and Nvidia has reportedly cut RTX 50 production in early 2026. None of this points toward a correction.
What a Data-Driven Buyer Should Actually Do
Stop shopping the chip and start shopping the variant. Every RTX 5070 Ti is an AIB card, and the spread between cheapest and most expensive on identical silicon regularly exceeds $200 for a 3% clock difference. The value move is the cheapest card with an adequate cooler, not the highest-clocked one.
Set a price threshold and act on it rather than watching, because the watching window may be closing. At $850 or below the card is a strong buy and you should not deliberate — that price has been disappearing rather than returning. Above $1,050, run the RTX 5080 comparison instead: its street price starts around $1,249 for meaningfully more performance, and it is the 16GB card Nvidia is still clearly producing.
And verify what you receive. Run GPU-Z, confirm 80 ROPs, confirm the boost clock matches the model you paid for. Compare current listings across the AIB variants before committing — the cheaper models sell out first precisely because they are the ones worth buying, and with supply this thin, what is listed today is a poor guide to what will be listed next week.
See More:
- Nvidia beta
- Nvidia CUDA 11.8
- Check CUDA version
- Nvidia GPU for gaming
- PNY GeForce RTX 5080 16GB OC review
Final Verdict on RTX 5070 Ti TechPowerUp Data
Reading RTX 5070 Ti TechPowerUp charts correctly means holding three things in mind. The card’s placement is explained by its memory subsystem, not its core count — it inherits the RTX 5080’s 256-bit bus at 896 GB/s, which is why it lands within 10–14% of a card with 20% more shaders. The generational uplift figures depend entirely on whether Multi Frame Generation is counted: 10–15% without, up to 2x with.
And every performance-per-dollar number in every database is computed against a $749 MSRP that street pricing has ignored since launch. As of July 2026 the real range is $979–$1,049 at major retailers, and the supply picture is worse than the price suggests — AIBs have reported end-of-life status while Nvidia disputes it, and stock has been thin for months.
The practical conclusion for a data-minded buyer is unusual: the availability column matters more than any benchmark column right now. The hardware deserves its reputation. But if you find a 5070 Ti near list price, the analysis is done and the answer is buy it — and if you cannot find one at all, the RTX 5080 is the 16GB card still in production and the comparison worth running instead. Check your ROP count, shop the variant rather than the chip, and treat the charts as a starting point rather than a conclusion.
Frequently Asked Questions
What do the specification tables not tell me about the 5070 Ti?
Database entries list core counts, clocks, bus width and board power, but they cannot show sustained clock behaviour in a warm case, partner cooler quality, coil whine, or fan noise at load. Two cards with identical listed specifications can differ by several percent in sustained performance purely because of cooling and power limit headroom.
Are the listed boost clocks what the card actually runs?
No. Nvidia publishes a rated boost clock that is effectively a floor. In practice a well cooled 5070 Ti typically runs above that figure until it hits its power or thermal limit, then settles lower. Judge a card by sustained clocks in a thirty minute run, not by the number on the specification page.
How should I read relative performance percentages?
Aggregate percentage rankings blend many games and resolutions, which hides workload specific behaviour. A card that averages five percent ahead can be fifteen percent ahead in heavy ray tracing and level in CPU limited titles. Always check results at the resolution you actually play and in games from the genres you play.
What are the key hard numbers for the 5070 Ti?
It uses the GB203 die with 16GB of GDDR7 on a 256-bit bus for roughly 896GB per second, a total board power around 300W, a 12V-2×6 power connector, and a recommended 750W system supply. Those figures determine your power supply and case clearance planning more than any benchmark chart does.
Does the theoretical TFLOPS figure predict gaming performance?
Only loosely, and only within a single architecture. Comparing TFLOPS across generations or across vendors is misleading because cache sizes, memory subsystems, and fixed function hardware for ray tracing and upscaling differ substantially. Use measured frame rates in games you play, and treat the compute figure as a rough architectural note.
As an Amazon Associate we earn from qualifying purchases at no extra cost to you.


Ready to decide? Our #1 pick for 2026 is the Die.
Live price & availability on Amazon.
Write Your Review
No reviews yet. Be the first to share your experience!