HWiNFO GPU monitoring gives you an X-ray view of exactly what your graphics card is doing, from temperature and power to clock speeds and fan behaviour. If you have ever wondered why a game stutters, why your card runs hot, or whether it is healthy, the right monitoring tool answers those questions instantly. This review examines how well HWiNFO handles the job, which sensors truly matter, and what real users praise and criticise, so you know if it belongs in your toolkit.
What HWiNFO GPU Monitoring Actually Shows You
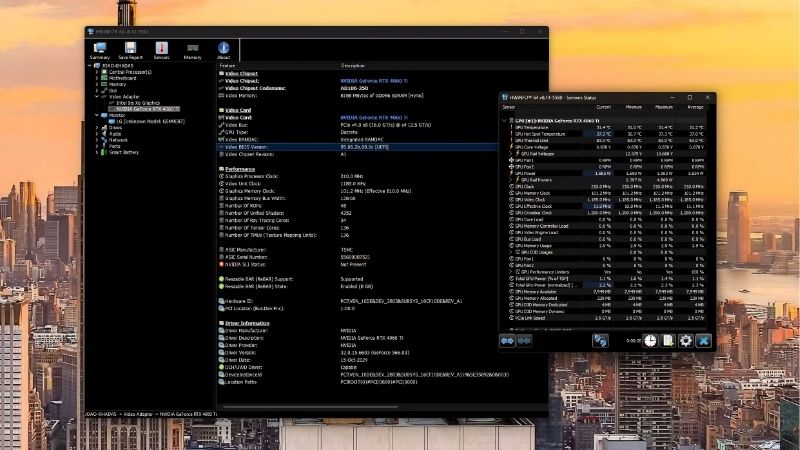
HWiNFO is a free, deeply detailed monitoring tool, and its strength is showing every sensor your card reports. Understanding which of those readings matter turns a wall of numbers into genuinely useful insight about your graphics card’s health and performance.
The Key GPU Sensors That Matter Most
A handful of readings tell you almost everything about your card’s health. GPU temperature and hot spot temperature reveal how hard cooling is working, while power draw shows how much the card is pulling under load.
Clock speeds and GPU usage explain performance directly. If usage sits near 100 percent your card is the limiting factor, and watching clock speeds reveals whether heat is forcing it to slow down, known as thermal throttling.
Fan speed and memory usage round out the picture. Fan behaviour confirms whether cooling is responding properly to rising heat, and video memory usage shows whether a demanding game is running out of the memory your card has available, a common and often overlooked cause of sudden stutter at high settings.
The table below summarises the sensors worth watching:
| Sensor | What it tells you | Watch for |
|---|---|---|
| GPU / hot spot temp | Cooling effectiveness | Above ~83C under load |
| GPU usage | Whether the card is the bottleneck | Near 100% while gaming |
| Core clock | Throttling behaviour | Clocks dropping under heat |
| Power draw | Load and efficiency | Hitting the power limit |
Reading the Data Without Getting Overwhelmed
HWiNFO’s biggest quirk is that it shows everything, which can feel like too much at first. The trick is to hide the sensors you do not need and keep only the handful above visible, turning a dense list into a clean dashboard.
Each reading also shows current, minimum, maximum, and average values. The maximum column is especially useful, because it captures the hottest moment or highest power spike during a long gaming session even if you were not watching.
Once you narrow the view, the data becomes genuinely readable. A quick glance tells you whether your card is running cool, being pushed hard, or slowing down, which is exactly the insight most users want.
A small amount of setup makes this far easier. HWiNFO lets you drag your chosen sensors into a compact window and even colour-code warning thresholds, so a value turns red the moment it strays out of a safe range. Spending five minutes arranging this once transforms the tool from an intimidating spreadsheet into a purpose-built dashboard that answers your specific questions at a glance, and the layout is remembered every time you open it.
How HWiNFO Compares to Simpler Tools
Compared with lightweight monitors, HWiNFO trades simplicity for depth. Simpler tools show a few headline numbers, while HWiNFO exposes sensors those tools never reveal, which is why enthusiasts and troubleshooters favour it.
That depth is its main advantage and its main drawback. For diagnosing a tricky problem it is unmatched, but for a casual user who only wants an on-screen temperature, a simpler overlay may feel less intimidating.
Many users happily run both. They use a minimal overlay while gaming and open HWiNFO when they want the full picture, getting the best of both worlds without compromise.
There is a practical reason this pairing works so well. A lightweight in-game overlay answers the everyday question of whether temperatures look fine right now, while HWiNFO answers the deeper questions that only surface when something goes wrong, such as which sensor spiked at the exact moment a game crashed. Treating the simple tool as your dashboard and HWiNFO as your diagnostic bench is how experienced users get thorough monitoring without cluttering their screen during normal play.
What Users Say About HWiNFO GPU Monitoring
Beyond features, the clearest signal comes from the people who rely on HWiNFO daily. Reading through user feedback reveals consistent themes in what earns praise and what causes frustration, which makes it easy to predict whether the tool suits your needs.
Why Enthusiasts Rate It So Highly
Power users consistently praise the sheer accuracy and completeness of HWiNFO’s data. They value being able to see sensors no other free tool exposes, which makes it their first choice for diagnosing crashes, throttling, or unusual behaviour.
Reliability earns repeated praise too. The tool is stable, actively maintained, and free, and many reviewers note that it has become an essential part of their troubleshooting routine precisely because it simply works and shows the truth.
Reviewers also value how HWiNFO logs data over time. Rather than only showing a live snapshot, it can record every sensor to a file during a long session, letting users scroll back and find the exact moment a temperature spiked or a clock dropped. For anyone chasing an intermittent problem that never seems to happen while they are watching, this logging ability is repeatedly singled out as the feature that finally revealed the cause.
Common Complaints and Their Fixes
The most frequent criticism is that the interface feels overwhelming to newcomers. The dense default layout intimidates casual users, though this is easily solved by hiding unneeded sensors to create a simple custom view.
A few users also find the initial setup fiddly compared with one-click tools. The fix is a little upfront effort to configure the layout once, after which it stays exactly how you like it and becomes effortless to use every time you open it.
HWiNFO GPU Monitoring Pros and Cons
Here is the honest balance sheet before you rely on it:
Pros:
- Free, accurate, and incredibly detailed sensor data.
- Exposes readings simpler tools cannot show.
- Stable, trusted, and actively maintained.
Cons:
- Dense interface overwhelms beginners at first.
- Initial setup takes a little configuration.
- Overkill for users who only want a temperature readout.
The verdict is straightforward: for anyone who wants to truly understand their graphics card, HWiNFO is the most capable free tool available today, provided you tidy the view to suit you.
Acting on What HWiNFO GPU Monitoring Reveals
Monitoring is only useful if you act on it, and HWiNFO’s real value is spotting problems early. Once the data shows an issue, a few practical fixes can bring your card back into a healthy range and keep it there.
Fixing High Temperatures and Throttling
If HWiNFO shows temperatures climbing above the low eighties or clocks dropping under load, heat is the culprit. The most common cause is poor case airflow, which starves the card of cool air during long sessions.
Adding or upgrading case fans is usually the simplest, most effective fix. A set of quality case fans dramatically improves airflow, lowering temperatures and stopping the throttling that quietly steals your performance, often for a very small outlay.
For older cards running hot, fresh thermal paste can also help. Replacing dried-out paste with a quality compound often drops temperatures by several degrees and restores lost stability.
Before spending anything, though, the cheapest fix is often simple cleaning. HWiNFO frequently reveals that a card creeping hotter over time is choked with dust, and clearing the fans and heatsink with compressed air can restore temperatures for free. Only once a clean card still runs hot does it make sense to invest in better fans or fresh paste, and the monitoring data is what tells you which stage you are actually at.
Spotting a Failing Card Early
HWiNFO is excellent for catching problems before they become disasters. Sudden temperature spikes, erratic fan speeds, or unexpected crashes visible in the data are early warnings worth investigating promptly.
Watching trends over time is especially valuable. If temperatures creep steadily higher over months, dust buildup or aging thermal paste is likely, and addressing it early prevents a bigger failure down the line.
This early-warning ability alone justifies keeping a monitoring tool installed. Catching a cooling problem before it damages your card can save you the cost of a replacement entirely, which makes a free tool remarkably good value.
Turning Data Into Better Performance
The data also guides smart upgrades. If usage sits at 100 percent while your frame rate disappoints, your card is the bottleneck, which tells you where an upgrade would actually help.
Conversely, if temperatures are the problem rather than raw power, improving cooling unlocks performance you already paid for. Using HWiNFO to diagnose the real limit stops you from wasting money on the wrong fix, which is perhaps the most valuable thing the tool does for everyday users.
Ready to act on what your monitoring reveals? If your card is running hot, use the links on this page to grab quality case fans or thermal paste and bring your temperatures, and your performance, back into a healthy range.
See More:
Conclusion
For anyone serious about understanding their graphics card, HWiNFO GPU monitoring is the most detailed and trustworthy free tool available, provided you trim its dense view down to the sensors that matter. Watch your temperatures, usage, and clock speeds, and act quickly when the data flags a problem. If heat is holding your card back, better cooling is the answer, so use the links above to grab quality case fans or thermal paste and keep your card cool, healthy, and fast for years to come.


Write Your Review
No reviews yet. Be the first to share your experience!