GPU-Z sensors turn a confusing wall of numbers into a clear health report for your graphics card, once you know what each reading means. If you have opened GPU-Z, glanced at the Sensors tab, and felt lost, this review is for you. It explains exactly which readings matter, how to interpret them, and what real users love and dislike, so you can diagnose heat, throttling, or a failing card with confidence.
Understanding the Most Important GPU-Z Sensors
GPU-Z is a free, lightweight tool whose Sensors tab reports everything your card is doing in real time. The value lies in knowing which of those many readings actually matter, so you can focus on a handful of numbers instead of drowning in data.
Temperature and Hot Spot Readings
Temperature is the single most important reading, and GPU-Z shows both the main GPU temperature and, on many cards, a hot spot value. The main temperature reflects overall heat, while the hot spot captures the hottest point on the chip.
As a rule of thumb, keep the main temperature below roughly 83 degrees Celsius under load. A hot spot naturally runs higher, but a very large gap between the two can hint at cooling that is not making good contact with the chip.
Watching the maximum temperature column is especially useful. It records the hottest moment during a long gaming session, revealing whether your card briefly overheats even when it looks fine at a glance.
It helps to know what a healthy range actually looks like so you are not alarmed by normal behaviour. Most modern cards happily sit anywhere from the sixties to the high seventies under a gaming load, and reaching the low eighties briefly is not a crisis. The number that should concern you is a card pinned at or above the mid-eighties for long stretches, because that is the point where cooling is clearly struggling and performance starts to suffer. Reading the sensor with that context turns a scary-looking figure into a calm, informed judgement.
Clock Speeds and Load Sensors
The clock speed and GPU load readings explain your card’s performance directly. GPU load shows how hard the card is working, and near 100 percent during gaming means the card, not another component, is the limiting factor.
Clock speed reveals whether heat is holding you back. If clocks drop during a long session while the card stays fully loaded, your card is thermal throttling, quietly reducing speed to protect itself from heat.
Reading these two together is powerful. High load with steady clocks is healthy, while high load with falling clocks points straight to a cooling problem worth fixing.
GPU load is also the key to spotting a very different issue: a processor bottleneck. If your frame rate feels low but GPU load sits well below 100 percent while gaming, your graphics card is not the limitation at all, and the processor or another part of the system is holding it back. This single reading can save you from upgrading the wrong component, which is one of the most common and expensive mistakes PC owners make when a game runs poorly.
Power, Voltage and Fan Sensors
Power draw and voltage readings show how much energy your card is pulling and at what electrical pressure. Hitting the power limit repeatedly means the card wants more power than its cap allows, which can gently restrain performance.
Fan speed confirms that cooling is responding properly. Fans should ramp up as temperature rises, so a fan sitting still while the card runs hot is an immediate red flag worth investigating.
The table below summarises the readings worth watching:
| Sensor | What it means | Watch for |
|---|---|---|
| GPU temperature | Overall heat | Above ~83C under load |
| GPU load | Whether the card is the bottleneck | Near 100% while gaming |
| GPU clock | Throttling behaviour | Clocks falling under heat |
| Fan speed | Cooling response | Fan idle while hot |
What Users Say About GPU-Z Sensors
Beyond the numbers, the clearest guidance comes from people who rely on GPU-Z every day. Their feedback reveals consistent themes about where the tool shines and where it frustrates, making it easy to judge whether it fits your needs.
Why It Is So Widely Trusted
Users consistently praise GPU-Z for being free, tiny, and accurate. It launches instantly, uses almost no resources, and reports readings that match what other trusted tools show, which is why it has become a default first check for millions of PC owners.
Its simplicity earns particular praise. Unlike heavier tools, GPU-Z presents a clean Sensors tab that most people can read after a quick explanation, making it approachable for beginners while still detailed enough for enthusiasts.
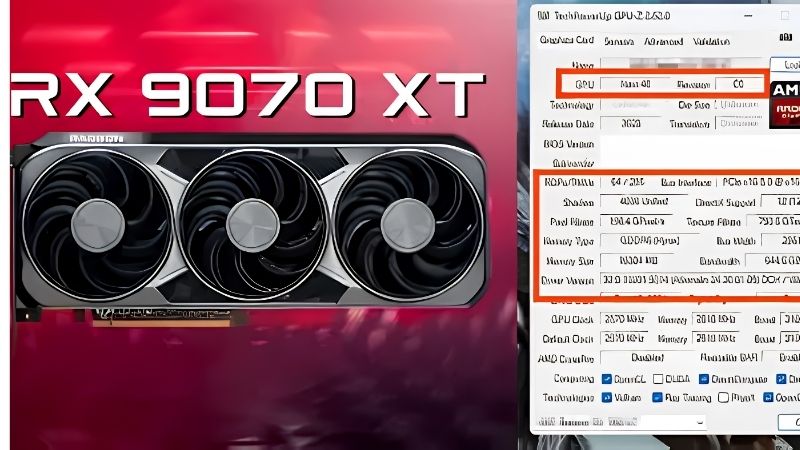
Reviewers also value GPU-Z for its identification abilities beyond the sensors. Its main tab confirms exactly which card you have, including the specific memory type and manufacturing details, which is invaluable when buying a used card or checking that a retailer sent the model you actually ordered. This combination of trustworthy sensor data and reliable hardware identification is a big reason the tool has stayed a community staple for so many years.
Common Complaints and Their Fixes
The main criticism is that the Sensors tab still shows more readings than a beginner needs, which can feel cluttered at first. The simple fix is to focus only on the handful of key sensors above and mentally ignore the rest.
A few users also wish it had a built-in on-screen overlay for gaming. GPU-Z is best as a diagnostic window rather than a live overlay, so pairing it with a separate overlay tool covers that gap neatly.
GPU-Z Sensors Pros and Cons
Here is the honest balance sheet before you rely on it:
Pros:
- Free, tiny, and instantly accurate.
- Clean layout that beginners can quickly learn.
- Trusted by the wider PC community for years.
Cons:
- Still shows some readings beginners will not need.
- No built-in in-game overlay.
- Diagnoses problems but cannot fix them for you.
The verdict is clear: for a fast, reliable health check of your graphics card, GPU-Z sensors are among the best free tools available, as long as you focus on the readings that matter.
Acting on What GPU-Z Sensors Reveal
Reading the sensors is only half the job; the real value comes from acting on what they show. Once GPU-Z flags a problem, a few practical fixes can restore healthy temperatures and unlock performance you already own.
Fixing High Temperatures and Throttling
If GPU-Z shows temperatures climbing into the mid-eighties or clocks falling under load, heat is the cause. The most common culprit is poor case airflow, which leaves the card breathing warm, recycled air during long sessions.
Adding or upgrading case fans is the simplest, most effective solution. A set of quality case fans improves airflow dramatically, lowering temperatures and stopping the throttling that silently drains your frame rate.
For older cards, dried thermal paste is often to blame. Replacing it with a fresh, quality compound can drop temperatures by several degrees and restore both stability and lost performance.
Before spending anything, the cheapest fix is often a simple clean. GPU-Z frequently reveals a card creeping hotter over months because dust has clogged its fans and heatsink, and clearing that out with compressed air can restore temperatures for free. Only when a clean, well-ventilated card still runs hot does it make sense to invest in extra fans or fresh paste, and the sensor readings are what tell you which stage you have actually reached.
Diagnosing a Card That Feels Slow
GPU-Z is excellent for pinpointing why a card underperforms. If load sits at 100 percent but frame rates disappoint, the card itself is the bottleneck, telling you an upgrade would genuinely help.
If instead temperatures are high and clocks are dropping, the card has more to give once it is cooled properly. This distinction stops you from wasting money, since cooling is far cheaper than a new card.
Reading the sensors before buying anything is the smart move. The data tells you exactly where the real limit lies, so you fix the right thing the first time.
This diagnostic clarity is genuinely money-saving. It is easy to assume a slow game means you need a new graphics card, but the sensors often tell a different story, whether a cooling problem, a power limit, or another component holding the card back. By spending a few minutes reading GPU-Z before reaching for your wallet, you replace guesswork with evidence and make sure any money you do spend goes toward the fix that will actually help.
Catching Problems Before They Grow
Regular checks with GPU-Z catch trouble early. Temperatures creeping higher over months usually signal dust buildup or aging paste, both easily addressed before they cause a real failure.
Sudden, unusual readings are also early warnings. Erratic fan speeds or unexpected temperature spikes deserve prompt attention, since catching them early can prevent lasting damage to your card.
Ready to act on what your sensors reveal? If your card is running hot, use the links on this page to grab quality case fans or fresh thermal paste and bring your temperatures, and your performance, back to healthy levels.
See More:
Conclusion
Once you know what to look for, GPU-Z sensors give you a fast, trustworthy health report on your graphics card for free, revealing heat, throttling, and bottlenecks at a glance. Focus on temperature, load, clock speed, and fan behaviour, and act quickly when the numbers flag a problem. If heat is the issue, better cooling is the fix, so use the links above to grab quality case fans or thermal paste and keep your card cool, healthy, and fast for years to come.


Write Your Review
No reviews yet. Be the first to share your experience!