The nvidia smi command is the fastest, most reliable way to see exactly what your GPU is doing straight from the terminal, with no extra software to install. If you run machine learning jobs, manage a server, or just want precise control over monitoring, this review is for you. It walks through the most useful options with copy-paste examples, weighs the real pros and cons, and shares pro tips so you can monitor your GPU like an expert.
What the Nvidia SMI Command Actually Does
The nvidia-smi command is a built-in utility that reports and manages the state of Nvidia GPUs directly from the command line. Understanding the core readings it exposes is the foundation for using it to monitor, troubleshoot, and optimise any GPU workload.
The Core Readings It Reports
Running the command on its own prints a live snapshot of your GPU. It shows temperature, power draw, memory usage, and utilisation, which together tell you almost everything about the card’s current state.
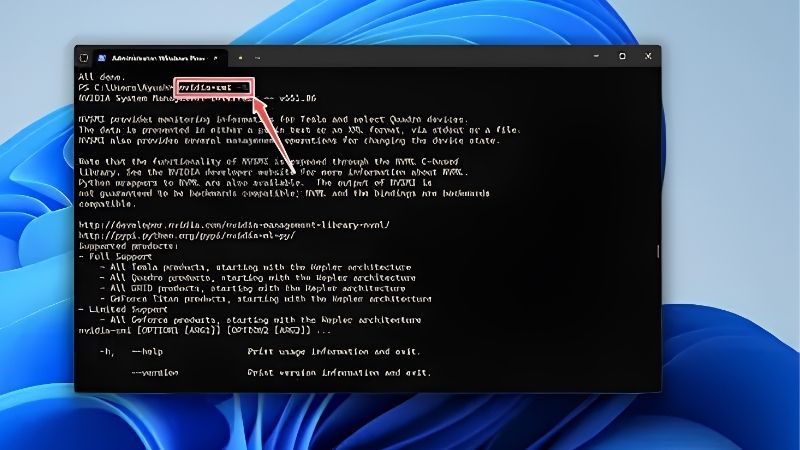
Try the basic command first:
nvidia-smiThe output includes GPU utilisation and memory used versus total, which are essential for anyone running demanding workloads. High memory usage with low utilisation, for example, often points to a job that is stalling rather than computing.
These readings are the same trustworthy numbers the driver itself uses, so they are accurate and reliable for real diagnostics rather than rough estimates.
The header of the output also carries important context that beginners often overlook. It lists your driver version and the supported CUDA version, which is invaluable when setting up machine learning frameworks that demand specific compatibility. A single glance confirms whether your environment matches what a library expects, saving hours of confusing errors that stem from a mismatched driver rather than your actual code. For anyone doing serious GPU work, that top line is often the first thing worth checking.
Watching Your GPU in Real Time
A single snapshot is useful, but continuous monitoring is where the command shines. You can refresh the output automatically to watch your GPU live during a long task.
Use this to refresh every second:
nvidia-smi -l 1This live view is invaluable while training a model or running a render, because you can watch temperature and utilisation climb and confirm the GPU is fully engaged rather than idling. It turns the terminal into a real-time dashboard.
For a cleaner refreshing view on Linux, many users pair it with the watch utility, which updates the display in place without scrolling.
Live monitoring is especially valuable for catching intermittent problems. A training run that mysteriously slows down, or a GPU that briefly spikes in temperature, is far easier to understand when you can watch the numbers move in real time rather than piecing together what happened afterwards. Keeping a live view open in a spare terminal during a long job is a habit many experienced users swear by, because it turns an invisible black box into something you can actually observe and reason about as it works.
Querying Only the Data You Need
The command’s real power is precise, scriptable queries. Instead of the full display, you can request only specific values in a clean format, ideal for logging or automation.
This example logs temperature, utilisation, and memory as comma-separated values:
nvidia-smi --query-gpu=temperature.gpu,utilization.gpu,memory.used --format=csvBecause the output is clean CSV, you can pipe it into a file or a script to build your own monitoring over time. This flexibility is exactly why developers and server admins prefer the command over graphical tools.
The same query approach scales beautifully to multiple GPUs. On a server with several cards, the command reports each one separately, so a single query can log the temperature and utilisation of an entire machine at once. This is how administrators keep an eye on whole fleets of GPUs without any heavy monitoring software, building lightweight, custom dashboards from a tool that is already present on every system. That combination of zero dependencies and full scriptability is difficult for any graphical alternative to match.
What Users Say About the Nvidia SMI Command
Beyond the features, feedback from developers and administrators shows how the command performs in daily use. Their experiences reveal clear themes about its strengths and its rough edges, helping you get the most from it.
Why Developers Rely on It
Developers praise the command for being built in, universal, and utterly dependable. It works on virtually any system with an Nvidia driver, needs no installation, and reports authoritative data, which makes it the default tool for GPU monitoring in professional workflows.
Its scriptability earns particular praise. Because the output can be formatted for automation, users build custom logging and alerting around it, which is far harder with graphical tools that were not designed for the terminal.
Remote work is another area where the command is indispensable. Because it runs entirely in the terminal, it works perfectly over a remote connection to a headless server that has no screen at all, which is exactly the environment where most serious GPU work happens. A developer training a model on a cloud machine or a rack of servers can check the health of every GPU without ever needing a graphical desktop. This ability to monitor hardware anywhere, over any connection, is repeatedly singled out as the reason the command remains irreplaceable in professional workflows.
Common Frustrations and Fixes
The main frustration is that the raw output can feel dense to newcomers. The fix is to learn the query options above, which let you display only the handful of values you actually care about in a clean format.
Some users also wish for built-in history, since the command shows the present moment rather than trends. The simple solution is to log queries to a file on a schedule, building your own history for later analysis whenever you need it.
Nvidia SMI Command Pros and Cons
Here is the honest balance sheet before you rely on it:
Pros:
- Built in and universal, with nothing to install.
- Accurate, authoritative readings from the driver.
- Highly scriptable for logging and automation.
Cons:
- Raw output feels dense to beginners.
- No built-in history without extra scripting.
- Command line only, with no graphical interface.
The verdict is clear: for accurate, scriptable GPU monitoring on any system, the nvidia-smi command is an essential tool, especially once you learn its query options.
Using the Nvidia SMI Command to Optimise Your GPU
Monitoring is only useful if you act on it, and this command excels at revealing problems worth fixing. A few practical readings point directly to the changes that keep your GPU cool, efficient, and fully utilised.
Spotting Thermal and Power Limits
The temperature and power readings quickly reveal cooling problems. If your GPU sits near its thermal limit during long jobs, it will throttle, slowing your work just as it does in games.
For a workstation or server running heavy loads, improving airflow is the fix. A set of quality case fans keeps a hard-working GPU cooler, which sustains performance through long training runs or renders instead of throttling.
Watching the power reading also matters. A card constantly hitting its power limit may be constrained, which is useful to know when tuning a demanding workload for stability and efficiency over long runs.
Diagnosing Underused Hardware
The utilisation reading is perfect for spotting wasted potential. If your GPU shows low utilisation during a job that should be intensive, something is bottlenecking it, often the data pipeline or processor rather than the card.
This insight saves money and time. Rather than assuming you need a faster GPU, the command shows whether your current card is even being fully used, so you fix the real bottleneck first instead of overspending.
Memory readings tell a similar story. Watching memory usage helps you size workloads correctly and avoid the out-of-memory errors that halt long jobs unexpectedly.
This diagnostic clarity is genuinely money-saving for anyone tempted to buy more hardware. It is easy to assume a slow job means you need a bigger or faster GPU, but the utilisation and memory readings frequently reveal that the existing card is barely being worked, with the real bottleneck sitting in the data loading, the processor, or the code itself. Confirming this before spending anything ensures that any upgrade you do buy solves the actual problem, rather than adding expensive hardware that sits just as idle as before.
Keeping a Hard-Working GPU Healthy
For GPUs under sustained heavy load, monitoring keeps them healthy for years. Regularly checking temperature and fan behaviour catches cooling problems before they cause throttling or damage, which protects both your performance and your investment.
Cooling is the most common upgrade a heavy user needs. If the command shows persistently high temperatures, better case airflow or fresh thermal paste keeps a hard-working card running cool and reliable through the longest workloads.
Ready to keep your GPU cool under load? If nvidia-smi shows high temperatures during your workloads, use the links on this page to grab quality case fans or thermal paste and protect the performance of your hard-working card.
See More:
Conclusion
The nvidia smi command is the most accurate, flexible, and universally available way to monitor a GPU, giving you authoritative readings and full scriptability straight from the terminal. Learn its query options, watch it live during demanding jobs, and treat high temperatures as a clear signal to improve cooling before they cost you performance. If heat is limiting your hard-working card, better airflow is the answer, so use the links above to grab quality case fans or thermal paste and keep your GPU cool, healthy, and fast for years to come.


Write Your Review
No reviews yet. Be the first to share your experience!