
GPU benchmark charts can make a graphics card purchase look simpler than it is. A bar that is 12% longer does not automatically mean the card is 12% better for your games, monitor, or budget. Many buyers compare results from different games, resolutions, quality presets, and driver versions as if they were directly interchangeable. Others focus on average frames per second while overlooking 1% lows, power draw, memory capacity, or the size of the card inside the case.
Knowing what to look for in GPU benchmarks means reading the testing conditions before reading the score. The most useful benchmark is not necessarily the one with the highest frame rate; it is the one that resembles how you will actually use the GPU. Use the guide below to separate meaningful performance differences from chart noise and marketing claims.
Decide These 3 Things First
- Your target resolution and refresh rate: A card that is excellent at 1080p may be limited at 4K, while a premium model can be poor value if you play on a 60Hz display. Decide whether your goal is 1080p at 60 to 144 fps, 1440p at 100 to 180 fps, or 4K at 60 to 120 fps.
- The games and applications you use: Rasterized games, ray-traced games, video editing, 3D rendering, and AI workloads can favor different GPU architectures. A single overall score cannot represent all of them.
- Your system limits: Check case clearance, power-supply capacity, CPU performance, monitor connections, and cooling before comparing benchmark results. A faster card is not useful if it cannot fit, cannot receive enough power, or is held back by the rest of the system.
Size and Physical Fit
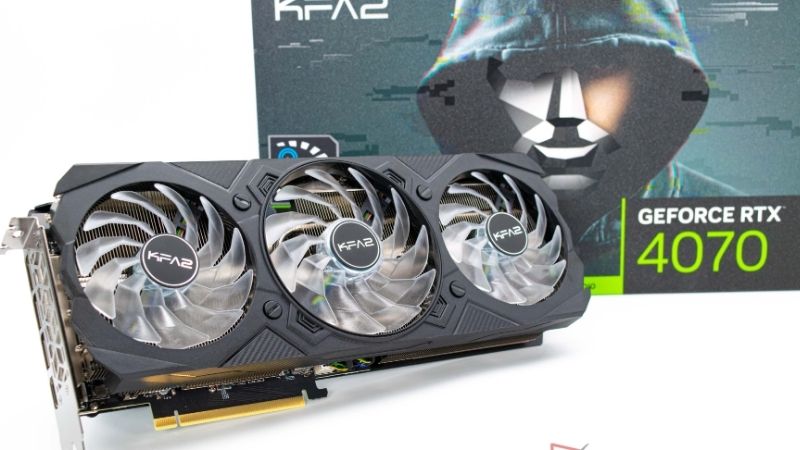
GPU benchmarks usually measure performance, not whether the card fits your computer. Check the manufacturer’s dimensions, including the thickness in expansion slots. A typical compact card may be about 200 to 250 mm long and two slots thick. Larger high-performance cards can exceed 330 mm, occupy three or four slots, and require substantial clearance below the primary PCIe slot.
Leave at least 25 mm of practical breathing room in front of the fans where possible, and confirm that front-mounted radiators, drive cages, or cable channels do not reduce the listed clearance. Measure the case from the rear bracket to the nearest obstruction, rather than relying only on the case’s advertised maximum GPU length.
Weight matters as well. Cards around 1 kg are usually easy to support, while models approaching or exceeding 2 kg benefit from a support bracket. Sag rarely changes benchmark performance immediately, but it can strain the slot and make installation less secure. Include vertical clearance for the power connector: many modern cards need 30 to 40 mm for a safe cable bend.
Material and Cooling Design
Materials do not create benchmark performance by themselves, but they affect whether a GPU can sustain its performance. Look for a substantial heatsink, a rigid backplate, multiple heat pipes or a vapor chamber, and fans that can stop at low temperatures. Aluminum heatsink fins are common because they provide a useful balance of weight, cost, and heat transfer.
Compare temperature and noise results only when the test environment is similar. An open test bench generally produces different temperatures from a closed case. Room temperature also matters: a result recorded at 21°C ambient cannot be compared directly with one recorded at 28°C.
For a gaming card, sustained GPU temperatures in the roughly 65°C to 80°C range are commonly comfortable, but the exact number depends on the design and workload. More important than chasing one temperature is whether the card maintains its clock speed without severe fan noise or thermal throttling. Look for noise readings in decibels, preferably from the same test suite, and treat a 3 dB difference as meaningful rather than trivial.
Construction of the Benchmark Test
The test method is the foundation of every result. Before comparing two GPUs, confirm that the review uses the same resolution, graphics preset, API, ray-tracing setting, upscaling mode, and frame-generation setting. A 1440p result using balanced upscaling is not equivalent to native 1440p, even if both charts carry the same resolution label.
Prefer reviews that test at least 8 to 12 games across different engines. A single title can favor a particular architecture and produce a misleading conclusion. Look for a mix of competitive games, open-world games, ray-traced titles, and demanding releases. Productivity buyers should also seek application-specific tests, such as encoding, rendering, or viewport performance.
Frame-time data is more useful than an average alone. Average fps describes the general output, but 1% low results reveal stutter and slow moments. For example, 120 fps average with 1% lows near 55 fps may feel less consistent than 105 fps average with 1% lows near 75 fps. Frame-time graphs can expose hitching that a simple bar chart hides.
Comfort and Performance in Real Use
For gaming, start with the frame rate needed by your display. At 60Hz, a stable 60 fps may be more valuable than an expensive card producing 140 fps. At 144Hz or 165Hz, prioritize cards that can maintain high 1% lows at your chosen resolution. Competitive players may value latency and consistent frame delivery more than visual features.
Separate native rendering, upscaling, and frame generation. Native results show the GPU’s direct rendering ability. Upscaling can improve performance by rendering internally at a lower resolution, while frame generation inserts additional frames and may increase perceived smoothness without reducing input latency to the same degree. A chart should identify these modes clearly.
Memory capacity is another decisive factor. A card with 8GB may be adequate for many 1080p settings, while 12GB to 16GB provides more flexibility for high-resolution textures, 1440p, and heavier ray tracing. Buyers targeting 4K or modded games should examine dedicated memory use and not rely on average fps alone. If a benchmark shows sudden stutter or severe 1% lows at a setting, insufficient memory may be the reason.
Also compare total board power. Mainstream cards may use approximately 100W to 200W, while faster models can draw 250W to 450W. Higher power can deliver more performance, but it affects electricity use, case heat, connector requirements, and fan noise. Check the recommended power supply, not just the card’s typical draw; a 750W to 1,000W supply may be appropriate for some high-power systems depending on the CPU and configuration.
Price Tiers and Value
Compare performance per dollar rather than the most impressive absolute score. Approximate street-price tiers can be organized as follows:
- Budget, $200 to $350: Best suited to 1080p gaming, modest ray tracing, and systems with 500W to 650W power supplies. Look for at least 8GB of memory, with 12GB preferable where available.
- Midrange, $350 to $700: The broadest value category for 1440p. Cards with 12GB to 16GB are generally more adaptable to demanding settings and longer ownership.
- Premium, $700 to $1,200 or more: Intended for high-refresh 1440p, 4K, heavy ray tracing, content creation, or specialized workloads. Confirm that your monitor and CPU can use the extra performance.
Calculate the cost of the complete upgrade. A more powerful GPU may require a new power supply costing $90 to $200, a larger case, additional cooling, or a higher-resolution monitor. If the card is only 10% faster in the games you play but costs 30% more, the cheaper option may be the better purchase.
Warranty and Long-Term Support
Check the warranty length, registration rules, and whether it follows the product or the original purchaser. A three-year warranty is more reassuring than a one-year term, especially for a card costing $700 or more. Read the conditions for replacing thermal pads, removing the cooler, overclocking, and using a support bracket.
Driver support is equally important. Look for a manufacturer with regular game-ready drivers and a clear process for reporting problems. Benchmark results can change after driver updates, so note the driver version and test date when comparing reviews. Results from different driver generations should be treated as directional, not perfectly precise.
Delivery and Assembly
Inspect the card immediately after delivery. Photograph the box, check the anti-static packaging, and look for bent brackets, damaged fins, loose fans, or a connector that appears overheated. Do not force a large card into a tight case. Remove the appropriate expansion-slot covers, support the card while fastening it, and connect every required power lead fully.
Use separate power cables from the supply when recommended instead of relying on one daisy-chained cable. Keep connectors straight and avoid sharply bending them near the plug. After installation, run a repeatable game or benchmark for 20 to 30 minutes, monitor temperature and power, and listen for unusual rattling. Save your baseline results so future driver or cooling changes can be evaluated fairly.
Spec Checklist
| Spec | Budget | Mid | Premium |
|---|---|---|---|
| Typical target | 1080p, 60–144 fps | 1440p, 90–165 fps | 4K, 60–120 fps |
| Memory | 8GB minimum | 12–16GB | 16GB or more |
| Power draw | 100–200W | 180–300W | 250–450W |
| Recommended PSU | 500–650W | 650–850W | 850–1,000W |
| Common card length | 200–280mm | 250–330mm | 300–360mm |
| Useful benchmark data | Average fps and 1% lows | Raster, ray tracing, and memory use | 4K, ray tracing, productivity, and power |
Red Flags
- A review lists only one game, one resolution, or one average-fps score.
- The chart does not identify drivers, CPU, RAM, graphics preset, or upscaling mode.
- Frame generation is enabled for one card but disabled for another.
- Claims use words such as “up to” without showing the complete test set.
- Temperature or noise results come from different rooms, cases, or fan profiles.
- The card’s memory capacity is omitted even though high-resolution textures are part of the test.
- The product is physically too long, too thick, or too power-hungry for your system.
- A large price premium buys only a small performance gain in your actual games.
FAQ
What is the most important GPU benchmark number?
For gaming, use average fps together with 1% lows at your target resolution and settings. Average fps shows speed, while 1% lows provide a better indication of consistency. For professional software, use benchmarks from the exact applications you plan to run.
Should I trust synthetic benchmarks?
Use them for a quick comparison of theoretical capability, stability, and feature support, but do not make a purchase from synthetic scores alone. Game and application benchmarks are more relevant because different engines can produce very different performance rankings.
Is more VRAM always better?
No. Memory capacity does not guarantee a faster GPU, but too little memory can cause stutter, texture problems, or poor 1% lows. Match capacity to resolution, texture quality, ray tracing, and how long you expect to keep the card.
How much benchmark difference is worth paying for?
There is no universal threshold, but a 5% to 10% gain is often difficult to notice unless it moves a game past an important target, such as 60 fps or your monitor’s refresh rate. A 20% to 30% gain is more meaningful, provided the card also fits your case, power supply, and workload.





Write Your Review
No reviews yet. Be the first to share your experience!