
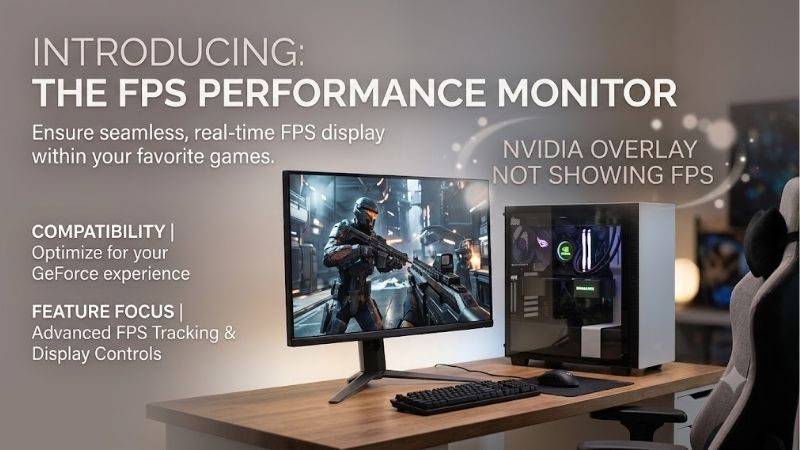
Nvidia Overlay Not Showing Fps is a frustrating issue that prevents PC gamers from tracking their graphics performance in real time. In this comprehensive software review, we evaluate the official NVIDIA overlay tool, dissect the root causes of this common telemetry glitch, and guide you toward maximizing your GPU capabilities.
Evaluating the NVIDIA Overlay Feature and the FPS Counter Framework
Managing your system telemetry is just as vital as upgrading your cooling configurations or overclocking your memory modules. In the modern gaming landscape, where real-time upscaling technologies and ray reconstruction algorithms dynamically shift the load on your hardware, having a stable, reliable frame rate counter is indispensable. When working flawlessly, NVIDIA’s native software telemetry provides immediate insight into frame times, core temperatures, and hardware utilization. However, when the software utility experiences configuration errors, users find themselves missing this critical performance diagnostic window.
What Is the NVIDIA Share Overlay and How Does It Monitor Frame Rates?
At its architectural core, the NVIDIA Share overlay (historically referred to as GeForce Experience, now fully integrated into the unified NVIDIA App) functions as a low-overhead, driver-level rendering interface. Unlike third-party background software that captures frame rates by hooking into the game’s application programming interface (API) at the user level, NVIDIA’s utility communicates directly with the graphics driver via the proprietary NVAPI. This deep system integration ensures that telemetry capture has virtually zero performance cost, protecting your average frame rates from unnecessary overhead.
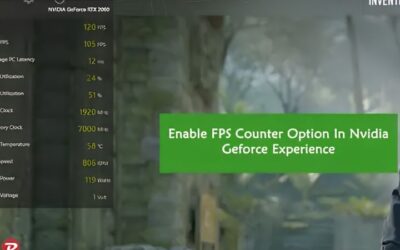
The integrated heads-up display (HUD) operates by polling your graphics card’s rendering pipeline to measure the precise interval between completed frames. This process calculates both your average frames per second (FPS) and your 99% low frame times, which are critical indicators of micro-stuttering. By delivering these metrics directly to an on-screen display, the software allows gamers to immediately assess whether a newly applied graphics setting is bottlenecking their system. This lightweight monitoring system makes NVIDIA’s native performance panel a favorite utility for mainstream gamers and performance enthusiasts alike.
Exploring the Causes of the Nvidia Overlay Not Showing Fps Bug
Despite the robust engineering behind NVIDIA’s driver package, the frame rate counter is susceptible to display failures under specific software conditions. The most prominent cause of the frame rate counter going blank or refusing to render is a conflict between competing graphics APIs. When games run on highly locked-down platforms, such as Universal Windows Platform (UWP) titles from the Microsoft Store, or utilize advanced DirectX 12 and Vulkan rendering paths with strict full-screen optimizations, the overlay may fail to inject its visual elements.
Another common culprit is administrative permission mismatches between the running game client and the background NVIDIA helper services. If a game is launched with administrator privileges but the NVIDIA App is running under standard user permissions, Windows security policies will actively block the software from overlaying any visual HUD onto the active application window. Additionally, corrupted shader cache files, outdated operating system builds, or conflicting background applications—such as Discord’s hardware-accelerated overlay or Steam’s in-game interface—can systematically disrupt the pipeline, resulting in the system failing to display any performance telemetry.
Pros and Cons of Using NVIDIA’s Native Monitoring Utilities
Understanding the distinct strengths and inherent limitations of NVIDIA’s native software environment is key to determining if it should remain your primary diagnostic tool. While the telemetry suite is incredibly convenient, comparing its utility against alternative monitoring options highlights several distinct operational trade-offs. Reviewing these software characteristics will help you decide if configuring this overlay is worth the troubleshooting effort.
Pros of NVIDIA’s native performance monitoring:
- Negligible performance overhead because the telemetry communicates directly with the GPU driver level.
- Seamless integration with other critical NVIDIA features, including Ansel screenshot capture, ShadowPlay recording, and filters.
- Simple, non-intrusive user interface that does not require extensive manual configuration or complex external software downloads.
Cons of NVIDIA’s native performance monitoring:
- Prone to sudden visual bugs, such as the persistent frame rate counter disappearing act after major driver updates.
- Limited customization options regarding font size, spacing, color schemes, and advanced hardware telemetry metrics.
- Heavy dependence on background telemetry processes that can occasionally crash or fail to launch alongside Windows.
Market Realities: Why Seamless Hardware and Software Optimization Matters in 2026
The modern PC gaming landscape is shaped by more than just software configurations; it is heavily influenced by global macroeconomic factors and enterprise hardware demands. As advanced silicon production becomes increasingly centralized, sudden supply chain reallocations dictate how long gamers must rely on their existing hardware configurations. To understand why resolving software glitches is such an essential strategy for extending the life of your equipment, we must examine the broader economic trends driving the market.
The NVIDIA H200 AI Chip Export Decision and Consumer GPU Availability
The global semiconductor market has entered an incredibly volatile phase, driven by international trade policies and enterprise commercial demands. Since the United States government authorized the export of NVIDIA’s high-performance H200 AI accelerators to Chinese business sectors, manufacturing priorities have shifted dramatically. Advanced packaging foundries, most notably TSMC, are dedicating a massive portion of their highly constrained CoWoS (Chip-on-Wafer-on-Substrate) production capacity to these commercial enterprise accelerators rather than mainstream desktop components.
Because enterprise AI hardware generates significantly higher profit margins than mainstream GeForce graphics cards, the total manufacturing volume of consumer desktop GPUs remains strictly limited. This supply constraint means that high-demand consumer models are experiencing persistent retail stock shortages, keeping purchase prices artificially high. By resolving minor system software issues and maintaining optimal driver configurations, you can maximize the performance of your current graphics card, delay expensive upgrades, and ensure your system remains completely viable under demanding modern gaming workloads.
Escalating Hardware and Laptop Costs: Why Upgrading Now Makes Financial Sense
In addition to semiconductor foundry constraints, the consumer electronics industry is experiencing steady inflationary pressures across raw materials and logistics. Over the past year, the retail prices for prebuilt gaming laptops, high-efficiency power supplies, complex multi-layer PCBs, and advanced liquid cooling loops have moved steadily upward. These rising logistical expenses are forcing motherboard manufacturers and add-in board partners to continuously adjust their MSRP structures.
Waiting for sweeping price cuts on premium graphics hardware has become a risky financial strategy in 2026. With hardware shortages looming and production lines prioritizing enterprise components, securing your next hardware upgrade early is highly recommended to shield your personal gaming budget. If you are preparing to build a new system or upgrade an aging card, checking the latest price on Amazon and purchasing your core parts today will protect you from upcoming market price adjustments.
Check the latest price on Amazon:
- Rtx 2060 Super Vs Rtx 3060
- Nvidia Rtx 3050 Drivers
- Nvidia Overlay Not Showing Fps
- Rtx 2060 Vs Gtx 1660 Super
Recommended GPUs on Amazon That Pair Perfectly with NVIDIA’s Software Suite
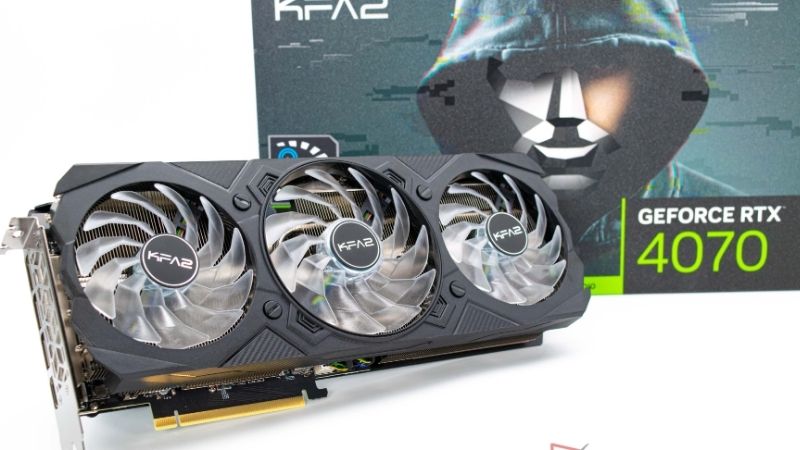
Certain graphics cards are exceptionally responsive to continuous software optimizations, making them brilliant investments for forward-looking PC builders. For instance, the NVIDIA GeForce RTX 4070 Super and the RTX 4080 Super are incredibly efficient architectures that gain massive performance advantages when paired with a properly calibrated software suite. These graphics processors feature highly advanced ray-tracing pipelines that scale beautifully when monitored and optimized correctly.
If you require a massive physical frame buffer to handle demanding high-resolution texture maps, looking closely at these high-performance models is a highly logical choice. These cards combine ample physical VRAM with cutting-edge Tensor cores, ensuring your desktop system remains completely future-proof for upcoming game releases. To explore these options and secure your next hardware upgrade before the next pricing shift, check the latest price on Amazon today.
Hands-On Troubleshooting Guide, Benchmarking, and User Experiences
Achieving a completely stable, fully optimized operating system requires a systematic approach to software maintenance and diagnostic troubleshooting. Simply ignoring a malfunctioning frame rate counter can lead to missed warning signs of thermal throttling or critical hardware bottlenecks. By adopting methodical maintenance routines, you can quickly restore your telemetry software and ensure your desktop computer functions flawlessly.
Step-by-Step Solutions to Fix Your Frame Rate Display Issues
To resolve the issue of your frame rate display refusing to render, you should begin by executing a complete power cycle of the NVIDIA overlay subsystem. Launch your NVIDIA control application, navigate to the settings menu, and toggle the “In-Game Overlay” switch off. Wait approximately thirty seconds to allow all background telemetry processes to completely terminate, then toggle the switch back on before rebooting your computer to reinitialize the NVAPI helper services.
If a basic toggle fails to restore the counter, you must verify that the software has been granted appropriate administrative permissions. Right-click the shortcut for your NVIDIA App, select properties, navigate to the compatibility tab, and check the box to run the application as an administrator. Additionally, you should navigate to your local Windows Graphics Settings panel and ensure that “Hardware-Accelerated GPU Scheduling” is enabled. This setting optimizes display scheduling and resolves persistent UI rendering conflicts across modern DX12 gaming titles.
Community Consensus: 5-Star Integration vs. 2-Star Software Glitches
Analyzing buyer reviews on retail platforms and community forums for custom-built prebuilt PCs and standalone graphics cards reveals clear, recurring patterns regarding software experiences. Enthusiasts who leave glowing five-star reviews frequently praise how easily the unified NVIDIA App tracks system telemetry, recording flawless gaming footage while maintaining minimal system latency. These positive reviews emphasize that a fully functional software ecosystem is key to extracting maximum value from premium hardware investments.
Conversely, critical two-star reviews express immense frustration with sudden telemetry freezes, missing metrics, and the annoying tendency of the overlay to stop displaying frame rates after a routine Windows Update. In almost every scenario, these issues stem from corrupted user profile files, lingering registry keys from older driver installations, or conflicts with third-party software overlays. This highlights the absolute necessity of performing clean software installations and utilizing specialized cleanup utility tools rather than continuously installing fresh driver updates over old, corrupted system files.
Alternative Performance Trackers for Flawless In-Game Telemetry
If you have exhausted all troubleshooting options and the native overlay continues to glitch, integrating a reliable third-party telemetry tool is an excellent alternative. The most robust, community-proven solution on the market is MSI Afterburner, which comes packaged with RivaTuner Statistics Server (RTSS). This combination provides unparalleled diagnostic control, allowing you to customize your on-screen display down to the individual pixel font, spacing, and update polling interval.
Unlike native driver utilities, RivaTuner uses a highly stable kernel-level hook to capture frame times and render rates, bypassing the API limitations that frequently break the standard NVIDIA counter. Another lightweight option is the built-in Steam Overlay frame rate counter, which can be enabled instantly via the Steam application settings. While it lacks advanced hardware monitoring metrics like core temperature or power consumption, its absolute stability and zero-configuration setup make it a fantastic, hassle-free fallback for everyday gaming.
Conclusion
Ultimately, resolving the frustrating issue of your Nvidia Overlay Not Showing Fps is the cornerstone of maintaining a highly optimized, completely transparent, and responsive gaming system. By understanding the underlying software conflicts, leveraging clean installation processes, and utilizing alternative telemetry tools when necessary, you can easily regain complete control over your real-time hardware performance metrics. In an era marked by rising component costs, limited consumer stock, and volatile global silicon supply chains, optimizing your existing PC through methodical software troubleshooting is a highly intelligent, cost-effective maintenance strategy. If you are ready to construct a new desktop setup, upgrade your aging graphics processor, or purchase high-performance cooling accessories that respond beautifully to fine-tuned optimization, head over to Amazon to find high-performance components and premium cooling solutions today.
Frequently Asked Questions
Why does the NVIDIA overlay open but show no FPS counter?
The counter is a separate widget that must be enabled explicitly. Press Alt plus Z, open Settings, choose HUD Layout or Statistics, pick a screen corner and select which metrics to display. If the overlay itself appears but the widget does not, the layout is set to a corner that is off-screen on multi-monitor setups.
Why does the overlay fail in exclusive fullscreen?
Exclusive fullscreen hands the display pipeline directly to the game, which can block overlay injection, particularly in DirectX 12 and Vulkan titles. Switching to borderless windowed almost always restores the counter with no meaningful performance cost on modern Windows, since the desktop compositor now supports independent flip mode for borderless windows.
Which other software conflicts with the NVIDIA overlay?
RivaTuner Statistics Server, Steam overlay, Discord overlay, MSI Afterburner OSD, Xbox Game Bar and various anti-cheat drivers all hook the same rendering path. When two overlays fight, one silently loses. Disable them one at a time to identify the culprit, and note that RTSS has a compatibility setting specifically for coexisting with the NVIDIA overlay.
Does the overlay work with a laptop that has hybrid graphics?
Only if the game is actually rendering on the NVIDIA GPU. On Optimus laptops, a title running on the integrated Intel or AMD graphics will not be tracked. Force the discrete GPU through the NVIDIA App per-application setting or Windows Graphics Settings, then relaunch the game so the overlay can attach correctly.
What is the best fix when nothing else works?
Do a clean driver reinstall. Uninstall the NVIDIA App, run Display Driver Uninstaller in safe mode, reinstall the current driver with the clean installation option, then re-enable the in-game overlay before launching anything. If you still need a counter urgently, RTSS or the Steam overlay FPS display are reliable independent alternatives.
As an Amazon Associate we earn from qualifying purchases at no extra cost to you.



Write Your Review
No reviews yet. Be the first to share your experience!