
NVIDIA FrameView produces a CSV with dozens of columns and a manual that explains each one in a sentence, which is technically documentation and practically useless. The tool is excellent. The problem is knowing which three numbers matter, what they are actually telling you about your system, and which ones will quietly lie to you if you capture wrong. This article goes column by column, flags the settings that ruin a capture, and ends with the part nobody writes: what to do once the numbers say your GPU is the problem.
What NVIDIA FrameView Measures and Why It Beats an FPS Counter
An FPS counter tells you a number. FrameView tells you whether that number is honest. The difference matters because average frame rate is the metric most likely to describe an experience you are not having — a game averaging 90 FPS while hitching every four seconds reports beautifully and feels broken.
The Three Metrics That Actually Matter
FrameView reports a long list. Three of them carry almost all the signal, and NVIDIA’s own documentation flags them as the key metrics for evaluating a game.
Avg FPS — average frames per second across the capture. Useful as a headline, useless on its own.
1% Low FPS — the slowest one percent of frames, averaged. This is the stutter number and it is the most important column in the file.
PC Latency (PCL) — how long between your input and the result appearing. This is responsiveness, and it correlates with FPS far more loosely than people assume.
Everything else — clocks, temperature, utilisation, power — is diagnostic context for explaining why those three look the way they do.
1% Low FPS: The Number That Exposes Stutter
This deserves its own section because it is widely misunderstood and because FrameView changed how it works.
1% Low FPS takes the slowest one percent of frames and averages them. That is different from the older “1% FPS” metric, which reported the 99th percentile — a single frame position rather than an average of the worst ones. NVIDIA’s own charts show the old metric missing the worst stutter in a capture entirely, because a percentile marker cannot describe how bad things get beyond it.
The reading rule is simple and worth internalising: the closer 1% Low sits to Avg FPS, the more consistent your experience. A game averaging 90 with a 1% Low of 78 is smooth. A game averaging 90 with a 1% Low of 31 is a stuttering mess that a benchmark chart would praise.
If you take one thing from this article, take that ratio. It explains most “my FPS is fine but it feels bad” complaints.
PC Latency Without Buying Hardware
This is FrameView’s genuinely distinctive feature and the reason it earns a place next to the alternatives.
Measuring end-to-end latency traditionally required hardware — a high-speed camera, or NVIDIA’s own LDAT device clamped to your monitor. FrameView reports PC Latency in software, in any game supporting PC Latency Stats, which includes DLSS 3 titles. No extra hardware, no camera, one hotkey.
Two things will make it show N/A and both are fixable. It reports N/A at the main menu in most Reflex games — start actually playing and it populates. And if it stays N/A during gameplay, you need to enable Latency Markers, which is what lets a game expose its internal latency data.
Reading the Overlay and the CSV Columns
Here is where most people get lost, because the tool produces two files with different purposes and an overlay that behaves differently during capture than outside it. Understanding the shape of the output takes ten minutes and saves you from analysing the wrong file.
The Overlay Columns Explained
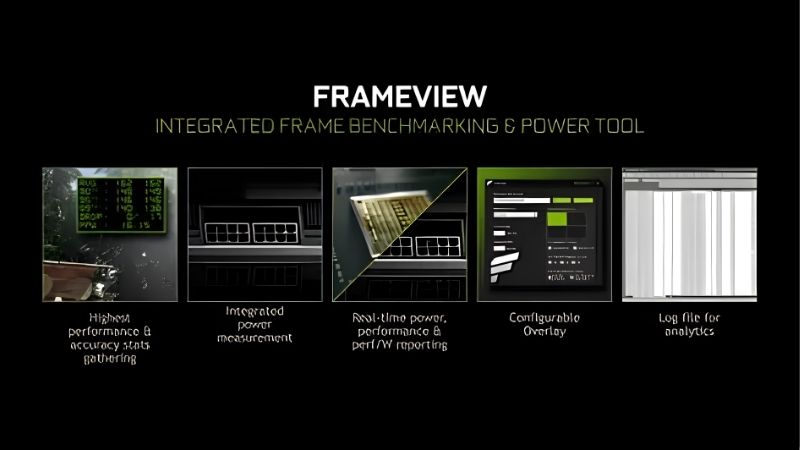
The live overlay shows average FPS, percentile FPS at 90, 95, and 99, dropped frames, render present latency, perf-per-watt, CPU and GPU utilisation, core speed, and temperature.
The percentiles read in a way people get backwards. 99th percentile means one frame in a hundred is slower than this rate — 99 percent of frames achieve at least it. 90th percentile means ten frames in a hundred are slower. Lower percentile, more forgiving number.
Two behaviours to know. The overlay disappears during data collection — that is deliberate, because removing it reduces overhead and produces a more accurate capture. It reappears with a summary when you stop. And the overlay does not draw in DX9 and DX10 games, though capture still works and the data still logs correctly.
FrameView 1.7 added the ability to choose which metrics appear, which matters more than it sounds — a full stats panel is a lot of screen real estate to give up mid-benchmark.
The Log vs the Summary File
Every capture produces two CSV files and confusing them wastes time.
| File | Contains | Use it for |
|---|---|---|
| Log | Every frame, per-frame | Frame time analysis, finding specific stutters |
| Summary | High-level, all runs | Comparing configurations, reporting results |
The Log holds per-frame metadata — resolution, runtime, flip model — alongside power, temperature, frequency, and utilisation sampled at intervals. It is where you go to find when a stutter happened.
The Summary is one row per run. It is what you want when comparing DLSS on versus off, or two driver versions. NVIDIA ships an Excel analysis template for exactly this, and it flags mismatches between captures — different resolutions, runtimes, or GPU names turn red — which catches the errors that invalidate a comparison.
Both files are UTF-8 CSV and open in Excel, Calc, or Sheets. Rename them as you go; the default names are the process name and a timestamp, and after six runs you will not remember which was which.
Power: Where the Numbers Come From
This column confuses people because the source changes depending on your hardware, and the tool does not shout about it.
For NVIDIA cards, FrameView reads power through NVAPI — a software interface — reporting both total board power including graphics memory, and GPU chip-only power. That is genuinely useful and it costs nothing.
If PCAT is connected, FrameView uses it instead. PCAT is NVIDIA’s hardware Power Capture Analysis Tool, and it measures actual board power delivered through the PCIe slot plus up to three 6- or 8-pin feeds. This is why reviewers use it: it measures the card in isolation rather than inferring from a wall meter.
The caveat that matters if you compare across vendors: AMD’s API reports a value that sits somewhere between chip power and full board power, which means you cannot directly compare AMD and NVIDIA power numbers from the API alone. Perf-per-watt only appears for AMD boards when PCAT is connected. Any comparison you see without PCAT is comparing two different definitions of power.
Pros and Cons of FrameView vs the Alternatives
FrameView is not the only tool and it is not automatically the right one. A meaningful share of reviewers have moved elsewhere, and knowing why tells you whether you should follow them.
Where FrameView Wins
Per-frame power reporting with PCAT integration is the standout, and it is why the tool persists in professional use. Nothing else ties frame data and hardware-measured board power together this cleanly.
Software PC Latency is the second and it is close to unique. Getting latency numbers without hardware is a real capability that most alternatives cannot offer.
Vendor neutrality on frame data is the third. FrameView captures FPS on NVIDIA, AMD, and Intel GPUs, integrated and dedicated. The power measurement is where the vendor asymmetry bites, not the frame rate.
Where CapFrameX and PresentMon Win
Be honest about this rather than pretending otherwise. Many testers have moved to CapFrameX for its instant data visualisation from log files and built-in RTSS overlay support. FrameView gives you a CSV; CapFrameX gives you a chart.
FrameView is built on PresentMon, and its foundation has lagged behind the upstream project. Current PresentMon releases carry bug fixes and additional metrics — including telemetry improvements for Intel Arc — that FrameView has not inherited.
The honest summary: use FrameView if you have PCAT or want latency numbers. Use CapFrameX if you want to see your results without opening Excel.
The Gotchas That Ruin a Capture
Variable refresh rate distorts your data. NVIDIA’s own analysis template flags captures taken with G-SYNC enabled, because it changes how frames present. Disable VRR when benchmarking, then re-enable it for playing.
Do not change settings or switch window focus mid-capture. The template flags these too — alt-tabbing during a run produces a file full of artefacts that look like real stutter.
Version 1.7 fixed a memory leak that crashed long sessions in Reflex-enabled games, and a rare case where V-sync, G-Sync, and DLSS Frame Generation together produced spurious results. If you are running an older build and getting numbers you do not believe, update before you troubleshoot your hardware.
Using FrameView to Decide Whether to Upgrade
Here is the part every FrameView guide skips. You did not install a measurement tool for fun — you installed it because something felt wrong and you wanted to know what. Once the numbers are in, the question becomes what to do about them, and 2026 has an unusually specific answer.
What Your Numbers Are Telling You
Read the diagnosis before reaching for the wallet. If GPU utilisation sits near 100 percent and your 1% Low tracks close to your average, you are genuinely GPU-limited and running smoothly — a faster card would help.
If GPU utilisation is low while frame rates disappoint, your GPU is waiting on something else. That is a CPU limit or a storage limit, and a new graphics card will change nothing. This is the single most common misread and it costs people real money.
If your 1% Low collapses far below your average while GPU utilisation swings, the usual culprit is VRAM. Your frame buffer is full and the driver is streaming assets mid-frame. Drop texture quality one notch and re-run the capture — if the 1% Low recovers, you have your answer, and it is a settings answer rather than a purchase.
What an Upgrade Costs in 2026
Suppose the numbers genuinely say GPU. The market has an opinion about your timing.
Component costs never drifted back toward 2024 levels — they kept climbing, with memory driving most of it. The clearest evidence landed this month: NVIDIA restarted production of the five-year-old RTX 3060 12GB and returned it to shelves near its original 2021 price, because rebuilding old silicon on an idle node had become cheaper than manufacturing something current.
There is real good news and it deserves accurate reporting. The steep escalation of late 2025 has flattened. Framework and other manufacturers have described a stretch of comparative steadiness — while stating plainly that they do not consider the volatility finished. Prices stopped climbing; nobody has reported them falling.
Relief Waits Until Late 2027
Capacity is genuinely being added on a public schedule. Micron has two new fabrication plants going up in Idaho, and CXMT in China has broadened the DDR5 supplier pool that manufacturers draw from. Both are substantive.
Neither arrives this year. The Idaho facilities are not scheduled to produce until the 2027 to 2028 window, and industry forecasting does not expect meaningful consumer price relief before late 2027 at the earliest.
Which brings the argument back to your CSV. In a market that will not reward waiting and will not reward impulse either, the most valuable thing you own is an accurate diagnosis. FrameView is free. Run the capture, read the 1% Low against the average, check GPU utilisation, and buy only what your own data justifies.
Compare what your capture says is limiting you against what an upgrade at your tier actually improves before spending anything — a low GPU utilisation number means the card is not your problem, and no purchase fixes that.
See More:
- NVIDIA
- NVIDIA DeepStream
- NVIDIA GPU driver update
- NVIDIA GeForce NOW download
- NVIDIA RTX A2000 12GB driver
Conclusion
NVIDIA FrameView repays the twenty minutes it takes to learn. Three columns carry the signal: Avg FPS for the headline, 1% Low FPS for the stutter that the headline hides, and PC Latency for how the game actually feels under your hands. Read 1% Low against the average — the closer they sit, the more consistent your experience.
Know where the numbers come from. Power arrives via NVAPI unless PCAT is attached, AMD’s API reports a different definition of power entirely, and captures taken with G-SYNC on or with alt-tabbing mid-run are flagged for good reason.
Then use it for what it is for. A capture showing low GPU utilisation and disappointing frame rates means your graphics card is not the bottleneck — and with prices flat and no relief forecast before late 2027, a free tool that stops you buying the wrong thing is worth more than most upgrades.
Frequently Asked Questions
What does FrameView measure that other tools do not?
It combines frame timing with GPU-only and whole-system power estimation, letting you calculate performance per watt without external measurement hardware. It also reports PC Latency on supported Reflex titles, giving a click-to-photon style figure that pure frame time loggers like the older FRAPS approach cannot provide.
What do the 1 percent and 99th percentile columns mean?
The 1 percent low is the average of the slowest one percent of frames, showing how bad your worst stutters are, while the 99th percentile frametime expresses the same idea in milliseconds. A large gap between average FPS and the 1 percent low indicates inconsistent pacing, which feels worse than a lower but steady average.
How accurate is the power reading?
GPU power is read from onboard telemetry and is generally within a few percent of external measurement on modern cards. The whole-system figure is an estimate and less precise. For comparing two configurations on the same machine it is very reliable; for absolute wall-socket numbers use a physical meter.
Which GPUs does it work with?
FrameView logs frame timing on any vendor’s card including AMD and Intel, which makes it useful for cross-brand comparisons. The detailed power telemetry and PC Latency columns are richer on GeForce hardware, since they depend on NVIDIA driver instrumentation and Reflex integration in the game.
Does running it affect the benchmark results?
Overhead is negligible, typically well under one percent, because it hooks presentation events rather than rendering. Keep other overlays disabled while capturing though, since running multiple hooking tools simultaneously can cause conflicts, crashes and misleading frame time spikes that have nothing to do with the hardware under test.
As an Amazon Associate we earn from qualifying purchases at no extra cost to you.


Ready to decide? Our #1 pick for 2026 is the Log.
Live price & availability on Amazon.


Write Your Review
No reviews yet. Be the first to share your experience!