
- Top Pick: The AI Hardware Gold Rush: How to Invest in the Infrastructure Behind the AI Boom
- Best Value: The AI Value Chain: Who Really Makes the Money in the AI Boom — from Nvidia's Chips to AI Agents (Value Chain Decoded Book 1)
- Premium Choice: NVIDIA and the AI Revolution: From Graphics Cards to Artificial Intelligence: How Nvidia Became the Engine of the AI Boom
Nvidia revenue chart data tells one of the most dramatic growth stories in modern business, with annual revenue rocketing from around $27 billion to a record $215.9 billion in just a few years. The shape of that curve reveals exactly how the AI boom reshaped the company. This article lays out Nvidia’s revenue by fiscal year and quarter, explains what is driving the numbers, and points out what a revenue chart alone cannot tell you.

Nvidia’s Revenue Chart by Fiscal Year
The clearest way to grasp Nvidia’s trajectory is the annual view, since it strips out quarterly noise and shows the raw scale of the change. Note that Nvidia’s fiscal year ends in late January, so each fiscal year runs roughly one year ahead of the calendar.
The Annual Figures
It is worth pausing on what these steps represent in absolute dollars rather than percentages. Going from about $27 billion to $60.9 billion added roughly $34 billion of revenue in a single year, and the following two years each piled on far larger sums, with fiscal 2026 alone adding more than $85 billion over fiscal 2025. Increases of that size, layered year after year, are why the chart looks less like a gentle slope and more like a wall, and why Nvidia became one of the most valuable companies in the world in such a compressed window.
The table below charts Nvidia’s total revenue by fiscal year, and the acceleration is impossible to miss once the AI wave arrived. Each row is the company’s full-year revenue as reported in its official results.
| Fiscal year (ends Jan) | Revenue | Year-over-year |
|---|---|---|
| FY2023 | ~$27.0 billion | Roughly flat |
| FY2024 | $60.9 billion | +126% |
| FY2025 | $130.5 billion | +114% |
| FY2026 | $215.9 billion | +65% |
In just three fiscal years the company grew roughly eightfold, a pace almost unheard of at this scale. The chart’s near-vertical climb from FY2024 onward is the visual signature of the generative-AI infrastructure boom.
The Growth Story Behind the Curve
The inflection is easy to date because it lines up almost perfectly with the arrival of mainstream generative AI. Once large language models captured public and corporate attention, the race to build the computing infrastructure behind them turned Nvidia’s accelerators into the single most sought-after component in technology. Every hyperscaler, cloud provider, and well-funded startup wanted as many GPUs as they could get, and because Nvidia held a commanding lead in both the chips and the surrounding software, that demand flowed disproportionately to a single company, bending its revenue chart sharply upward.
The steep part of the chart began when demand for AI accelerators exploded. As companies raced to build generative-AI systems, orders for Nvidia’s data-center GPUs surged, turning a strong chip business into a hyper-growth one.
Before that inflection, FY2023 was roughly flat as a gaming-market downturn weighed on results. The contrast between that plateau and the vertical climb that followed is what makes the chart so striking.
The message of the curve is simple: Nvidia rode the single largest infrastructure buildout of the AI era, and its revenue chart is essentially a chart of that buildout’s momentum.
Understanding the Fiscal Calendar
One point that trips people up is Nvidia’s fiscal calendar. Because its fiscal year ends in late January, fiscal 2026 actually covers most of calendar 2025, which matters when you compare the chart to news events.
This offset means Nvidia often reports a “new” fiscal year while the calendar year is still underway, so aligning the chart with real-world milestones requires keeping the roughly one-year shift in mind.
Once you internalize that timing, the chart lines up cleanly with the AI events that drove it, and the year labels stop being confusing.
The Quarterly Breakdown
Zooming into quarters shows how relentless the growth has been, with almost every quarter setting a new record. This granularity reveals momentum that annual totals can mask.
Fiscal 2026 Quarter by Quarter
What made this sequence unusual was not just the direction but the consistency of the beats against expectations. Quarter after quarter, Nvidia not only grew but tended to exceed its own guidance, which reinforced the impression that the AI buildout was accelerating rather than stabilizing. For anyone tracking the chart in real time, each earnings report effectively redrew the top of the curve higher than the previous quarter had suggested was likely, a dynamic that fed enormous investor attention and made the stock one of the most closely watched in the market.
Across fiscal 2025, revenue climbed every single quarter: roughly $26.0 billion in Q1, $30.0 billion in Q2, $35.1 billion in Q3, and $39.3 billion in Q4, adding up to the $130.5 billion full-year total.
That steady quarter-on-quarter rise, with each period a fresh record, is what a healthy hyper-growth chart looks like. There was no pause or plateau within the year.
The consistency mattered as much as the size, since it signaled that demand was structural rather than a one-off spike, reassuring anyone reading the trend.
Fiscal 2026 and Beyond
The transition from fiscal 2026 into fiscal 2027 is especially telling, because it showed the growth rate reaccelerating rather than fading, with that first-quarter jump to a record figure landing well above the company’s own prior guidance. Skeptics had spent much of the period predicting an imminent plateau as the base grew, yet the chart kept extending its slope. That persistence is central to the whole story: the numbers did not merely stay large, they kept setting fresh records even after the base had already reached a scale most companies never approach.
The momentum continued into fiscal 2026, with quarterly revenue of about $44.1 billion, then roughly $46.7 billion, then $57.0 billion, and a record $68.1 billion in the final quarter, totaling $215.9 billion for the year.
Into the next fiscal year, the first quarter of fiscal 2027 reached a record $81.6 billion, up 85% from a year earlier, showing the curve had not yet flattened.
Each of these records extended the chart’s steep slope, confirming that the AI-driven demand behind the numbers remained firmly intact quarter after quarter.
Data Center Dominates the Chart
This concentration also reframes how you should read every other line on the chart. Because data center so thoroughly dominates the total, movements in gaming, professional visualization, or automotive barely register at the aggregate level, even when those businesses are individually healthy. In practical terms, the Nvidia revenue chart has become a proxy for global AI infrastructure investment, and anyone using it to understand the company must recognize that they are really looking at a single market’s spending patterns dressed up as a corporate total.
Peel back the total and one segment explains almost all of it: data center. By fiscal 2026, data center made up more than 88% of Nvidia’s revenue, dwarfing gaming and every other category.
This concentration is the single most important feature of the modern revenue chart. The company’s fortunes are now tied overwhelmingly to AI infrastructure demand rather than its historic gaming roots.
Understanding that mix is essential, because it means the chart is really a picture of AI data-center spending, with the rest of the business a comparatively small contributor.
Reading the Chart Wisely
A revenue chart is powerful but incomplete. Knowing what it reveals, what it hides, and the risks lurking behind it turns a pretty line into genuine understanding.
What the Chart Tells You
A well-constructed revenue chart is also a superb communication tool precisely because it needs no financial training to interpret. The story of a company transformed is legible at a glance, which is why the image circulates so widely in news coverage and social media. That accessibility is a genuine strength, but it is also a subtle trap, since the very simplicity that makes the chart shareable is what strips away the context a reader needs to judge whether the business behind the line is as healthy as the slope implies.
At its best, the revenue chart shows scale, momentum, and the timing of Nvidia’s transformation from a gaming-focused chipmaker into the backbone of AI infrastructure. The trend line captures the story at a glance.
It also lets you compare growth rates across years, making clear that even as percentage growth cooled from triple digits, the absolute dollar increases kept getting larger.
For a quick sense of how fast and how far the company has come, few visuals are as effective as this simple revenue curve.
What the Chart Doesn’t Show
Consider valuation as the clearest example of what the line omits. A soaring revenue chart says nothing about whether a stock is cheap or expensive relative to those revenues, which is one of the most important questions any investor faces. Two companies with identical revenue charts could be priced completely differently by the market, and only by pairing the chart with margins, cash flow, growth expectations, and price can anyone form a responsible view. The chart is a starting point for questions, not a source of answers.
Revenue alone omits crucial context: it says nothing about profit margins, costs, competition, or the concentration risk of leaning so heavily on one segment and a handful of large customers.
Nor does a revenue chart reveal external threats, such as export restrictions affecting sales to China, which have already forced Nvidia to absorb charges and adjust its outlook.
Treating the curve as the whole picture is a mistake; it is a headline figure that needs the rest of the financial statements to interpret responsibly.
Risks, Limitations, and a Disclaimer
Considering the pros and cons of relying on a revenue chart is worthwhile. On the plus side it is intuitive and shows momentum clearly; on the minus side it ignores profitability, risk, and valuation entirely.
Key risks behind the numbers include heavy dependence on data-center demand, exposure to a few very large customers, competition, and geopolitical factors like China export rules that can shift results quickly.
Please note that this article is for informational purposes only and is not financial or investment advice. Figures can change, so always verify against Nvidia’s official filings and consult a licensed financial advisor before making any investment decision.
See More:
- TechPowerUp GPU
- Nvidia H200 GPU price
- RTX 5050 Mobile
- Nvidia competitors
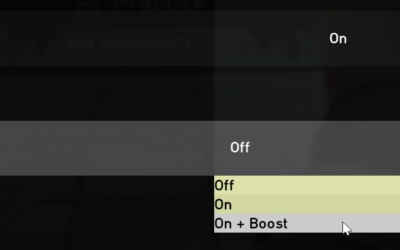
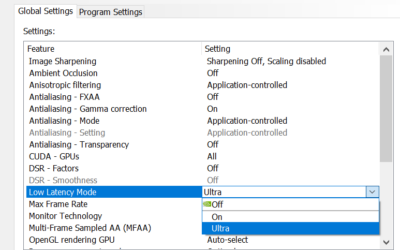
- Nvidia Reflex low latency on or off
The Bottom Line on the Nvidia Revenue Chart
The Nvidia revenue chart is a vivid record of one of the fastest large-scale growth stories in tech, climbing from roughly $27 billion to $215.9 billion on the back of AI data-center demand, but it is only a starting point rather than a complete financial picture. To understand the hardware actually driving those numbers, explore our in-depth GPU reviews and guides — and remember that nothing here is investment advice, so do your own research and consult a professional before acting on any figure.
Frequently Asked Questions
What shape does NVIDIA’s revenue chart take?
Steady growth through the 2010s, a cryptocurrency-driven bump and correction around 2018, a pandemic-era gaming surge, a flat and slightly declining fiscal 2023, then a near-vertical rise from fiscal 2024 onward. Annual revenue moved from roughly 27 billion dollars in fiscal 2023 to about 60.9 billion in fiscal 2024 and around 130.5 billion in fiscal 2025.
Which segment drives the steep part of the curve?
Data centre almost exclusively. It went from a minority contributor to roughly 115 billion dollars of fiscal 2025 revenue, close to ninety percent of the total. Gaming revenue has grown far more modestly across the same period, so plotting the segments separately shows two very different trajectories that the combined chart obscures.
Why do the chart labels not match calendar years?
NVIDIA’s fiscal year ends on the last Sunday of January, so fiscal 2025 covers roughly February 2024 to January 2025. Charts labelled by fiscal year are shifted almost a full year ahead of the calendar. When comparing against companies using December year ends, align the actual periods or the growth rates will appear misleadingly offset.
Should I look at quarterly or annual data?
Quarterly data reveals inflection points that annual figures smooth over, including the exact quarter when data centre revenue overtook gaming and the sequential deceleration or reacceleration that annual bars hide. Annual charts are better for showing long-term scale. For understanding momentum, plot sequential quarterly growth rather than year-over-year percentages, which stay inflated long after growth slows.
Where do I get accurate data to build my own chart?
Use NVIDIA’s quarterly CFO commentary documents and 10-Q and 10-K filings from the investor relations site, or pull the same filings free from SEC EDGAR. These contain segment revenue tables in a consistent format. Avoid chart images circulating on social media, which frequently mislabel fiscal periods or mix GAAP and non-GAAP figures without noting it.
As an Amazon Associate we earn from qualifying purchases at no extra cost to you.


Ready to decide? Our #1 pick for 2026 is the FY2023.
Live price & availability on Amazon.






Write Your Review
No reviews yet. Be the first to share your experience!