
- Top Pick: Chronological and Background Charts of the Old Testament (Zondervan Charts)
- Best Value: Christian Denominations: A Side-by-Side Comparison
- Premium Choice: Denominations Comparison Wall Chart


Prime
Editor's Pick
ASUS SFF-Ready Prime NVIDIA GeForce RTX 5070 Graphics Card (PCIe 5.0, 12GB GDDR7, HDMI/DP 2.1, 2.5-Slot, Axial-tech Fans, Dual BIOS), 3 Year Warranty

GPU comparison chart searches mean you want the whole market laid out in one place, so you can compare specs, memory, and prices at a glance instead of jumping between pages. You want a clear chart, an explanation of what the numbers mean, and best-buy picks by resolution, without a long video. This guide gives you the tables and the reasoning so you can find the right card and the best value fast.
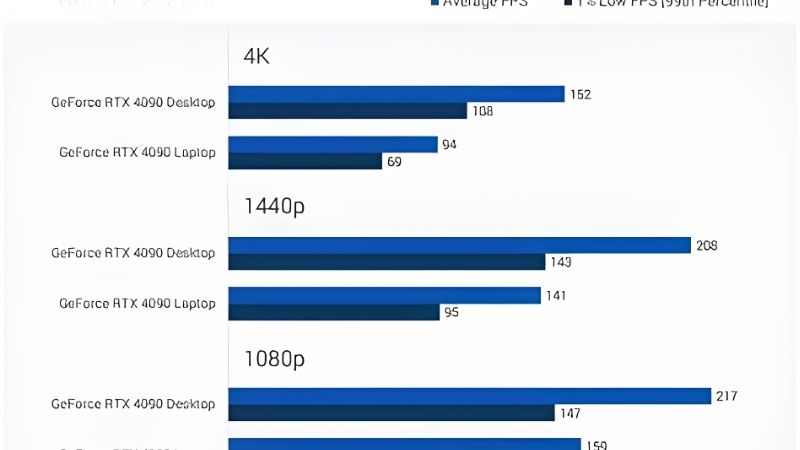
The 2026 GPU Comparison Chart
Before picking a card, you need the full landscape in front of you. This section lays out the main GPU comparison chart across NVIDIA and AMD, explains the key columns, and shows how to read the numbers, so the rest of your decision rests on clear data rather than guesswork. A chart turns an overwhelming market into a decision you can make in a couple of minutes.
As an Amazon Associate we earn from qualifying purchases at no extra cost to you.


Current GPUs at a Glance
Here is the core GPU comparison chart for 2026, covering the most popular current cards from both brands. The prices are approximate reference figures, so always confirm the live listing before buying, since street prices run higher. The reference figure sets your expectation, but the live listing is the number that decides value.
| Card | VRAM | Upscaling | Best resolution | Reference price |
|---|---|---|---|---|
| RTX 5060 | 8GB | DLSS 4 | 1080p | ~$299 |
| RX 9060 XT 16GB | 16GB | FSR 4 | 1080p, light 1440p | ~$349 |
| RTX 5060 Ti 16GB | 16GB | DLSS 4 | 1080p high-refresh, 1440p | ~$429 |
| RTX 5070 | 12GB | DLSS 4 | 1440p | ~$549 |
| RTX 5070 Ti | 16GB | DLSS 4 | 1440p high-refresh, 4K entry | ~$749 |
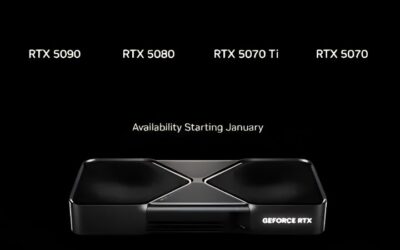
| RTX 5080 | 16GB | DLSS 4 | 4K | ~$999 |
| RTX 5090 | 32GB | DLSS 4 | 4K max, AI | ~$1999 |
This chart shows the full ladder from budget to flagship, but the value is not spread evenly across it, which is why the columns beyond price matter so much. Two cards at the same price can offer very different value once memory and features are weighed.
How to Read the Key Columns
The most important columns in any GPU comparison chart are VRAM, upscaling, and target resolution, not just price. VRAM determines how well a card ages, upscaling shapes real performance in supported games, and resolution tells you which card actually fits your monitor. Matching that column to your display is the single fastest way to narrow the whole chart.
Price is only meaningful once you weigh it against these factors, since a cheap card that runs short on memory is rarely the bargain it appears. Reading the chart holistically is how you avoid overpaying or underbuying. Reading only the price column is how buyers end up with the wrong card for their setup.
Reading read: judge each card across all the columns, not the price alone, and the genuine value picks become obvious. The cards that look good across every column, not just price, are the ones worth shortlisting.
Price Per Frame and Value Tiers
Analytically, the mid-range tiers usually deliver the strongest price per frame, while flagships charge a premium for the last increments of performance. The 5070 Ti and 5060 Ti 16GB are frequent value standouts for exactly that reason. They pair sensible pricing with enough memory to stay relevant for years rather than months.
The very cheapest cards can be a false economy if their VRAM limits them within a year or two, while the flagship is a capability purchase rather than a value one. The chart makes these patterns visible once you know where to look. The chart rewards a little patience, since the best value rarely sits at the very top or bottom.
Value read: the middle of the chart is usually where the smartest money sits, not at either extreme. The cheapest and most expensive cards each serve a narrow buyer, while the middle serves most people.
Best Buys From the GPU Comparison Chart
A chart is only useful if it points you to a decision. This section turns the gpu comparison chart into concrete best-buy picks by resolution, so you can match the data to your own setup and shop with confidence. The goal is to move from browsing to a clear decision without second-guessing yourself.
Best Budget 1080p Pick
For 1080p, the chart points to the RTX 5060 and RX 9060 XT 16GB as the standout value cards. The 5060 wins on efficiency, DLSS 4, and the lowest price, while the 9060 XT 16GB offers more VRAM and raw performance for a little more. Between them, the decision is simply whether the lowest price or extra headroom matters more to you.
Both handle modern 1080p titles smoothly and fit affordable builds, making either a strong foundation. The choice comes down to whether you value the lowest price or extra memory headroom. For a build you plan to keep, that headroom is usually the wiser side of the trade.
Budget verdict: the RTX 5060 for the cheapest capable card, or the RX 9060 XT 16GB for more VRAM to last longer. Either is a strong foundation, so let your budget and upgrade horizon make the final call.
Best 1440p Pick
For 1440p, the chart favors the RTX 5070 Ti as the sweet-spot pick, pairing 16GB of fast GDDR7 with DLSS 4 for high-refresh performance and even entry-level 4K. The RTX 5070 sits just below it as a more affordable 1440p option. If your budget is tighter, the 5070 still covers the resolution well for most titles.
This tier offers a genuinely high-end experience without the flagship price, which is why these cards are so often recommended. When one appears near reference pricing, it is usually the smartest money on the chart. Cards in this tier tend to sell quickly precisely because their value is so obvious.
1440p verdict: the RTX 5070 Ti is the standout, with the RTX 5070 as the value alternative for the resolution. Between them you are trading a little performance for a lower price, which suits many buyers.
Best High-End 4K Pick
For 4K, the chart points to the RTX 5080 as the sensible high-end choice, handling maximum settings at that resolution for far less than the flagship. The RTX 5090 sits above it for buyers who also need AI and creator capability. For those users, the flagship’s memory and compute justify a price pure gamers should avoid.
For pure 4K gaming, the 5080 offers the better value of the two, while the 5090 is a no-compromise capability purchase. The chart makes the gap in both price and purpose clear. Seeing them side by side makes it easy to buy the right tool rather than the biggest number.
High-end verdict: the RTX 5080 for 4K gaming value, or the RTX 5090 when flagship capability is genuinely needed.
Pricing, Timing, and Reading the Chart Smartly
A GPU comparison chart in 2026 is also a snapshot of a volatile market, so timing matters. This section covers the pricing context so you can judge when a listing on the chart is a genuine deal rather than an inflated one. Recognizing that difference is the single most valuable skill when shopping in this market.
Why Prices Are Elevated
Laptop and PC component prices have trended upward, and memory costs in particular have kept board prices high across the whole chart. That is why a card near its reference price counts as a genuine deal in today’s market. Recalibrating your sense of a fair price to current conditions is key to spotting real value.
This pressure hits every tier, so paying once for enough VRAM and performance can be cheaper than upgrading again sooner. The chart’s value picks are the cards that best resist that trap. Those are the cards that keep serving you well long after the purchase, which is the point.
Practical read: elevated pricing makes a well-matched, near-reference purchase the frugal choice across the chart. Spending precisely rather than ambitiously is how you get the most from a limited budget.
The Supply Relief Coming in 2027-2028
There is genuine good news, but it is modest and it sits in the future. Prices have stopped climbing as steeply as they did at the end of 2025, and some hardware makers report a relatively stable stretch while still warning of continued swings.
New supply is opening up too, with OEMs able to source DDR5 from Chinese suppliers such as CXMT and Micron building two plants in Idaho. The catch is that those fabs do not ramp until roughly 2027 to 2028, so meaningful relief for buyers is still a couple of years away.
Timing read: prices have leveled rather than fallen, so a well-priced card on the chart today is worth taking rather than waiting for a crash. A well-priced card in front of you now beats an uncertain discount that may never arrive.
Pros and Cons of Buying Now
Here is the honest pros and cons view of buying from the current gpu comparison chart, so you can act with clear eyes. Knowing the trade-offs in advance keeps a good listing from turning into an impulse you regret.
Buying now pros: prices have stabilized, modern upscaling makes today’s cards age well, and near-reference listings exist if you shop carefully. Cons: the market is elevated, so patience does not currently pay off much. Patience only helps when a genuine drop is on the horizon, and right now the signals point to stability.
The main risk is overpaying for a premium model that adds little real performance, so always measure any listing against the chart’s reference figures. Do that, and the chart becomes a reliable map to a confident purchase. Used well, the chart removes the anxiety from buying and replaces it with a clear plan.
See More:
- RX 9060 XT vs RTX 4060
- NVIDIA Jetson price
- NVIDIA GeForce GTX 1650 driver
- Intel Iris Xe graphics driver
- 9060 XT 16GB vs 5060 8GB
Final Verdict on the GPU Comparison Chart
The value of a gpu comparison chart in 2026 is that it lets you weigh specs, memory, and price together instead of chasing a single number, and the pattern it reveals is consistent: the mid-stack tiers offer the best value, while the extremes are for tight budgets or flagship needs. Read every column, buy for your resolution, and judge each card by its live street price rather than reference figures. With prices elevated but stabilizing, a well-matched purchase today is the smart move. Use the button below to check current live prices across the chart and lock in the best deal for your build. Used this way, the chart does the hard work of narrowing the field, leaving you a short, confident shortlist. From there, a quick price check is all that stands between you and the right card.
Frequently Asked Questions
How should I read a GPU comparison chart correctly?
Check three things before trusting any row: the resolution tested, the settings preset, and whether upscaling was enabled. Rankings reorder substantially between 1080p and 4K because CPU limits compress results at low resolution while memory bandwidth dominates at high resolution. A chart without those details is close to useless.
Which specifications matter most on a spec sheet?
Memory capacity and bus width tell you the most about longevity, and board power tells you what cooling and supply you need. Core counts only compare meaningfully within the same architecture, since a shader on one generation is not equivalent to a shader on another. Never compare CUDA cores against stream processors directly.
Do price-to-performance rankings change over time?
Constantly. Street prices move with supply, promotions and new launches, so a chart built on launch MSRP can be badly out of date within months. Recalculate using the price you can actually pay today, and include the cost of any power supply upgrade the card forces you into.
Why do older cards sometimes rank above newer ones?
Because tiers overlap across generations. A previous generation upper mid-range card frequently outperforms a current entry level part in raster while losing on efficiency and features. The model number is a marketing position, not a performance guarantee, which is why comparing measured results is the only reliable approach.
What is the best value tier to buy?
Historically the middle of the stack, where competition is strongest and dies are not competing with professional or AI products for supply. Look for the cheapest card that carries 16GB and supports current upscaling, then verify it fits your case, your power supply and your monitor’s resolution before buying.
Ready to decide? Our #1 pick for 2026 is the Card.
Live price & availability on Amazon.
Write Your Review
No reviews yet. Be the first to share your experience!